


In today’s Support Tip, we will continue with the basics of coordinate systems. We’ve already covered the core components of a coordinate system—the ellipsoid, geoid, and datum. Now, we’ll move to the component that will help you represent the surface of the Earth on a flat surface—a projection.
Thanks to the projection, you can get a map that describes any area on the Earth in meters or feet, which is much more convenient than using degrees. Imagine measuring your way to the bus station in degrees instead of meters. Sounds like a challenge, doesn’t it? Let’s figure out how the projection works.
What is a map projection?
A map projection is a method of representing a part or all of the Earth’s surface on a flat surface. To do this, the Earth’s surface must be projected onto shapes that can be represented on a plane. To get a better understanding of how it works, let’s take a look at the illustration below:
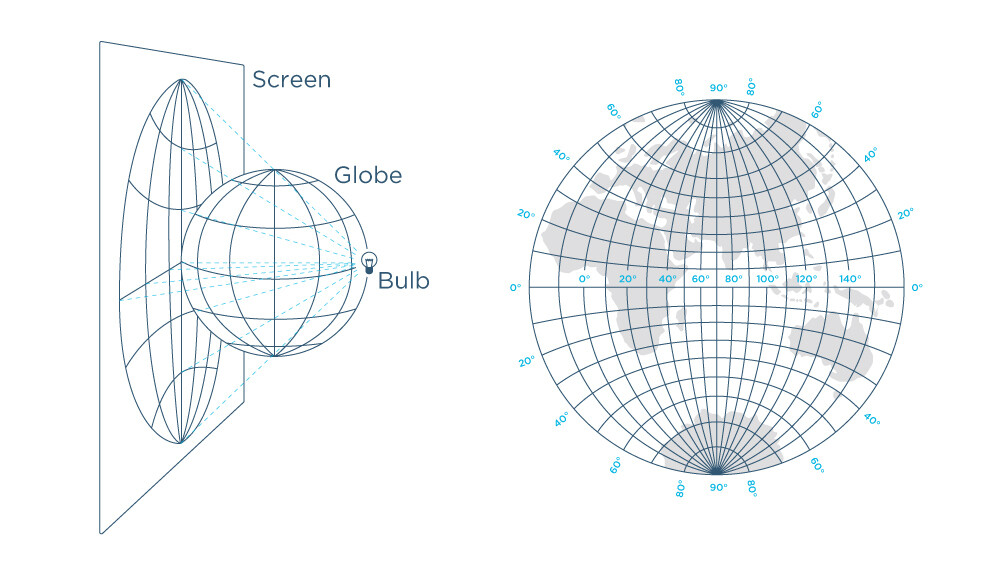
Here, the projection is made by placing a light bulb behind the globe and a piece of paper, in this case representing a plane, in front of the same globe. When the light bulb is turned on, the surface of the globe is projected onto the piece of paper becoming a map. The resulting map depends on how the paper is placed around the globe, i.e. what shape is used—plane, cone, cylinder, etc. That is why there are different types of projections.
Basic types of projections
The main types of projections are based on the shapes used and are as follows:
-
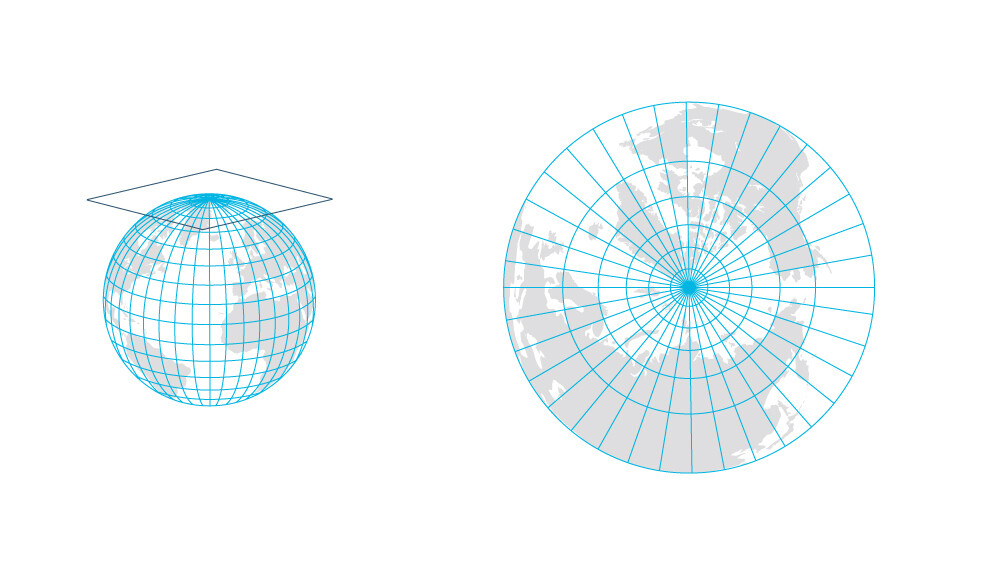
Planar
The planar projection projects the sphere on to a plane. This projection is most commonly used for topographic maps of polar regions, hemispherical and celestial maps.
-
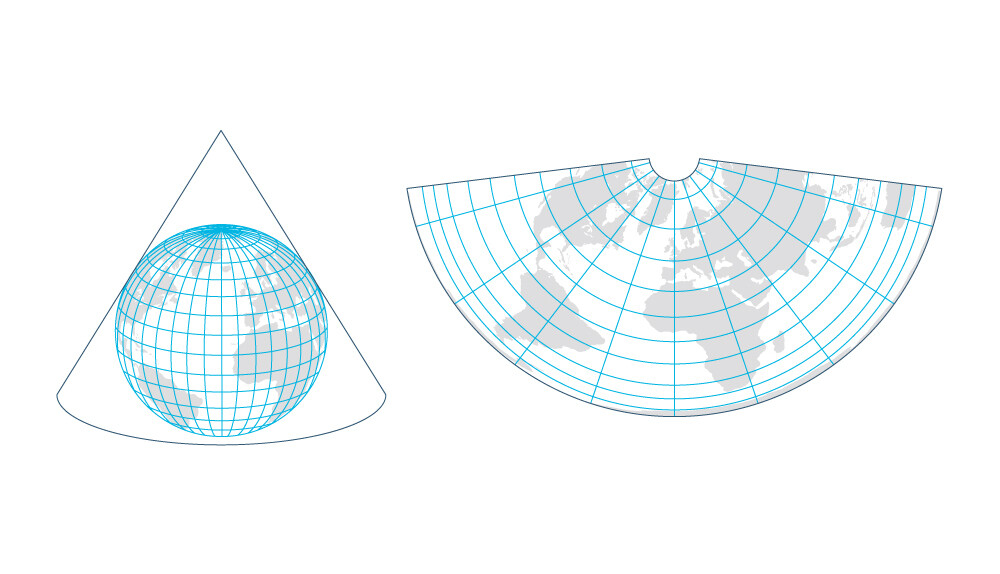
Conic
The conic projection projects the sphere on to a cone. This projection is typically used for mid-latitude zones with an east–west orientation and is usually applied only to parts of a hemisphere, such as North America or Europe.
-
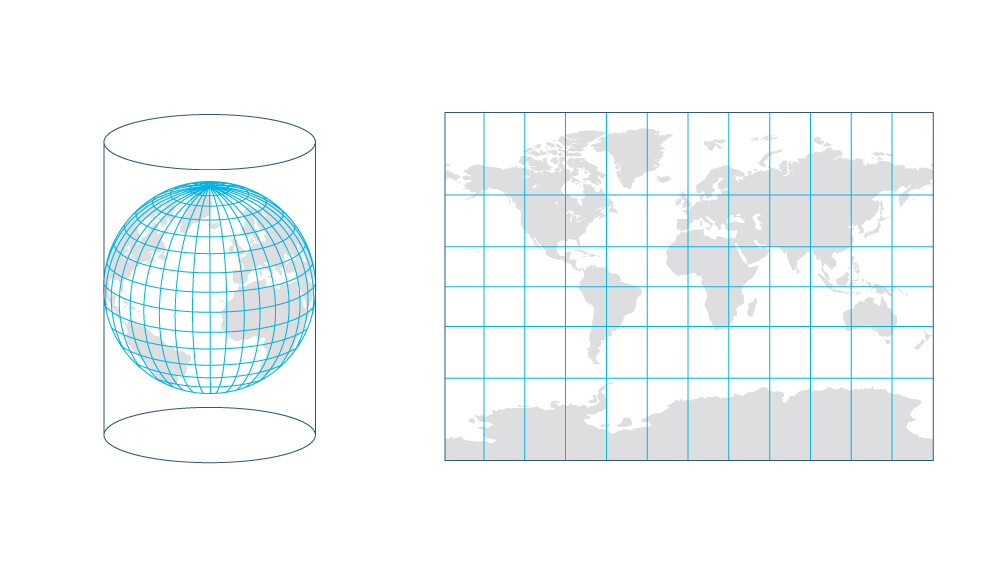
Cylindrical
The cylindrical projection projects the sphere on to a cylinder. This projection is suitable for large-scale maps, especially for depicting areas near the equator, and is generally not recommended for small-scale maps.
In all types of given projections there is a point where the paper touches the surface of the sphere. As a rule, these points are the most accurate and precise on the map in terms of scale, distance, direction, shape, etc. As we move away from these points, the map begins to distort.
Distortions
The truth is, it’s impossible to represent the sphere on a 2D map and keep angles, areas, shapes, sizes, or distances intact. In fact, you will always sacrifice something. If you try to make a plane out of the surface of the globe, you will have to crumple or even cut off some parts of it.
In addition to the type of shape applied, all projections can be subdivided based on the type of distortion:
- Conformal projections preserve true shapes and angles of small areas but distort their size. The examples here are aeronautical charts and topographic maps.
- Equal-area projections distort shape and direction but display the true relative sizes of all areas. The example is a distribution map.
- Equidistant map projections preserve distances, although only from one or two points to any other point on the map, or in certain directions. A world map can serve as an example.
There is no projection that preserves all the features at the same time. So you have to decide which is more important. Every map projection is a cartographer’s take on those compromises. There’s infinite number of projections, the majority of which are mixed because it’s the best way to keep almost all the features with minor distortions.
Don’t try to imagine the shape used, it’s all about the math and formulae used. The cartographer takes the basic shape, which with the help of different coefficients becomes something mixed, to create the best possible projection for the given area. So it’s all done for the sake of a correct calculation. You won’t look for a match between the map and the area in the field, you’ll work with the numbers to tie your project to the given territory. So at the end of the day, it’s just a formula describing how to get a pair of Easting and Northing from a pair of Longitude and Latitude.
Right choice
You may think it’s hard to make the right choice, but the good news is that it’s all been done for you. In most cases, there is an existing projection prepared and used for your particular area.
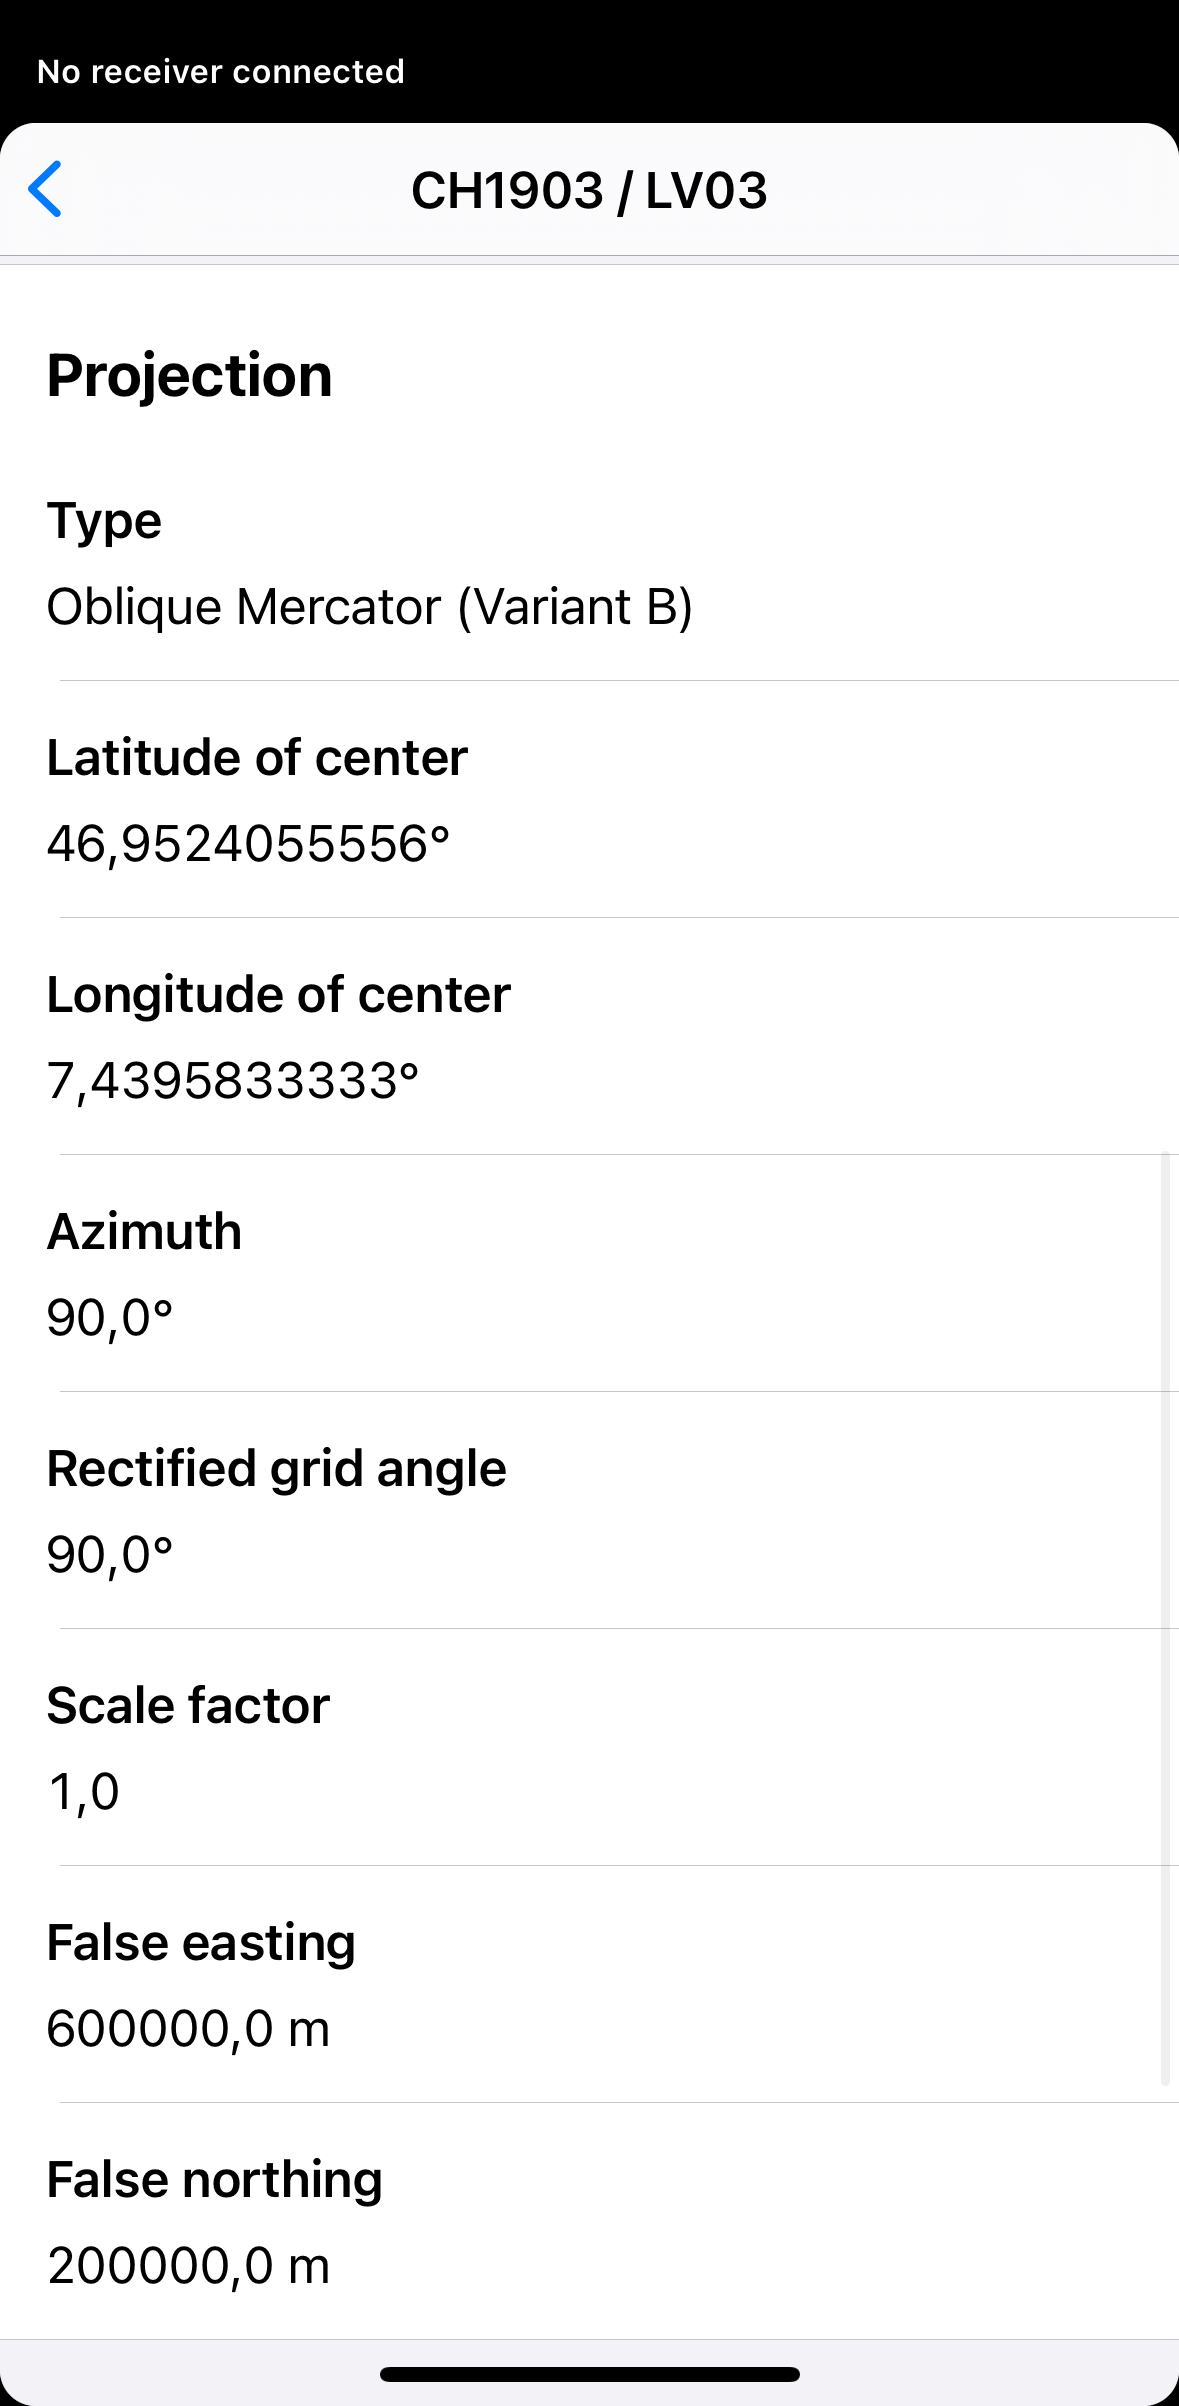
Someone has already calculated all the parameters and successfully applied the resulting projection. All you need to do is to pick the correct horizontal datum that contains the required projection in Emlid Flow or Emlid Flow 360. Have you ever tapped or clicked the info icon next to the datum? If not, do it right now—you’ll see the applied projection:
If you have any questions or need help setting up the correct coordinate system, leave your comments below or contact us at support@emlid.com.