I’ll start by saying I am very new to using GPS for mapping. I am learning this for work and trying to teach myself but I’ve come across a few roadblocks. Basically, the setup I have is two Reach RS2s, one rover one base. We use these for mapping significant points in fields and we put these surveys into ArcGIS to create maps. We use PPK for our corrections.
What I am struggling with is, I want to get a FIX status for my surveys, but even when I set my survey rule to FIX I only ever get SINGLE. I thought I would just need to wait for a FIX status but after waiting in one spot for 20 minutes I still didn’t get anything. I wonder if I am doing something wrong or if the conditions were not right? I have attempted on multiple different days in different conditions and have never achieved FIX. Any insight into this would be great, I can provide more information as needed.
When I actually go to post process the files, it seems to go fine. I get all the way up to the point where I get a finished .pos file from rtkpost but I dont know what to do from there. It doesn’t seem that ArcGIS accepts .pos files from the research I have done so is there a way to get the .pos files converted into either .csv or .shp?
Any insight into either of these problems would really help. I’m a bit overwhelmed with all this new stuff I have to learn and not sure I fully understand everything yet!
Did you follow the base and rover setup that Emlid makes available in the documentation?
RTKPOST only generates the .pos file as a result, in the WGS 84 coordinate system. You can copy the processing result (LAT, LONG and height) to a text file and use it in any software that accepts import in this way.
The columns sdn(m), sde(m) and sdu(m) are the standard deviations of the adjustment result.
Emlid Studio is a tool that can help you with your processing. It uses RTKLIB in the background. It is a more didactic interface to carry out your processing.
I did run through the Base and Rover setup that you linked. Correct me if I’m wrong, but that mostly applies to RTK and not PPK, right? I want to use PPK, I don’t know if that makes a difference.
I will give this a try, I assume that Microsoft Excel would work fine?
Where were you expecting to get a FIX solution as explained in your first post? That would only apply to a RTK setup if you were trying to get FIX survey points from the survey tab in Reachview 3.
I guess I’m not sure where I would get the FIX solution! I assumed it would be from the survey points but if I’m going about it wrong let me know. My understanding of the programs is still very limited haha!
If you want real-time surveying of points with a FIX solution, then you need a RTK setup. If you only need PPK, then you can use Emlid’s new PPK software (Emlid Studio) to get corrected points (PPK FIX). You’ll need to do your points survey in the field, but these will mostly be used for the time mark and will have a SINGLE solution. Then, in Emlid Studio using the Stop & Go feature, you can isolate the survey points from the raw log.
In RTK surveys, either LoRa protocol or NTRIP, the solution obtained is given in the field, at the moment the survey is being carried out (RTK). While in post-processing (PPK), the solution is obtained at the end of the procedure.
If you want centimeter accuracy in your surveys, the base needs to be set to that accuracy as well. I recommend this page in the docs, about how to placing the base, for more information.
By the way, I recommend reading all of Emlid’s documentation if you can. It’s a rich source of information about your receiver’s daily usage, and it’s sure to improve it.
Both RTK and PPK provide you with centimeter-accurate coordinates.
Post-processed kinematic (PPK) is the mode when you record logs with 2 receivers in standalone mode and then process them together. Please note that in PPK you can get a SINGLE solution only in the field. This is because there is no real-time connection between the receivers. You will get the precise coordinates only after post-processing.
For post-processing, you can use our version of RTKLib. We provide a guide in our docs that can walk you through all processing steps. However, we’ve recently released a beta version of the Emlid Studio. This is our own software for post-processing. Beta means that the software is still in the development phase. The whole process is described in this guide from our docs. We’d be glad to receive feedback from you!
Real-time kinematic (RTK) is the mode when a base sends corrections to a rover in real-time. It provides you with precise coordinates in the field but requires a connection between receivers via radio or Internet.
is there a way to get the .pos files converted into either .csv or .shp?
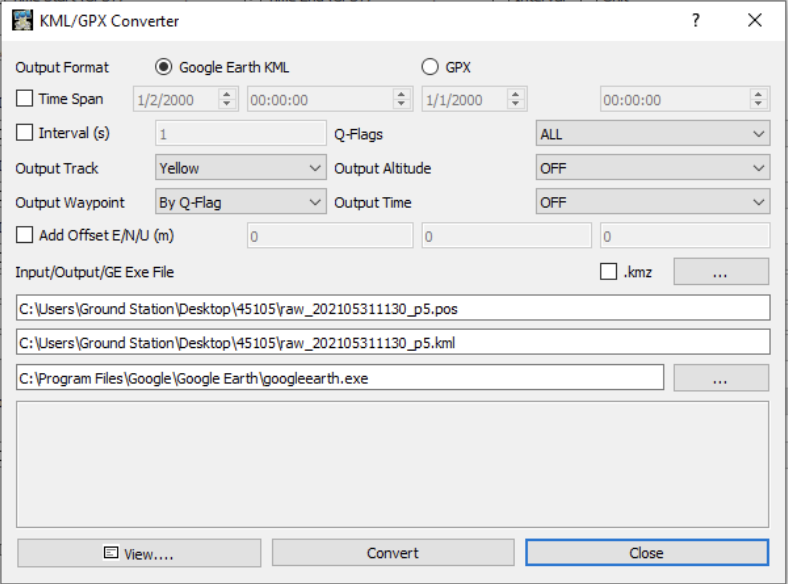
Unfortunately, it’s not that easy at the moment. You can convert the .pos file to the .kml with our version of RTKLib:
open RTKPost and hit on the KML/GPX… button
tap the Google Earth KML output format
In the Output Altitude field, choose Ellipsoidal altitude
In the Output Time field, choose UTC or GPST time depending on which is required
Click on Input/Output/GE Exe File and browse for the *_event.pos
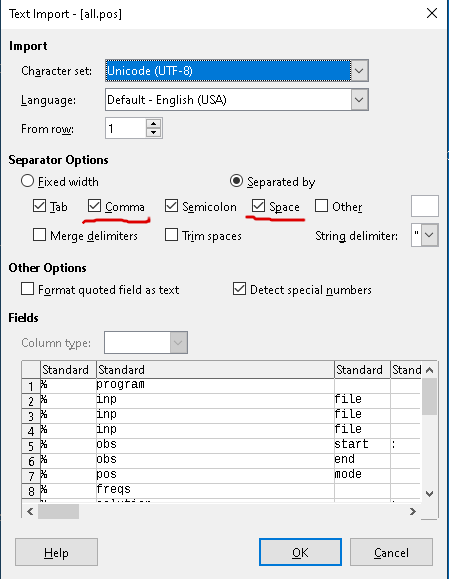
1-Open .pos with librieCalc with comma separator and space options
2- Remove all rows and columns but keep xyz columns (better to record macro)
3- Save as csv
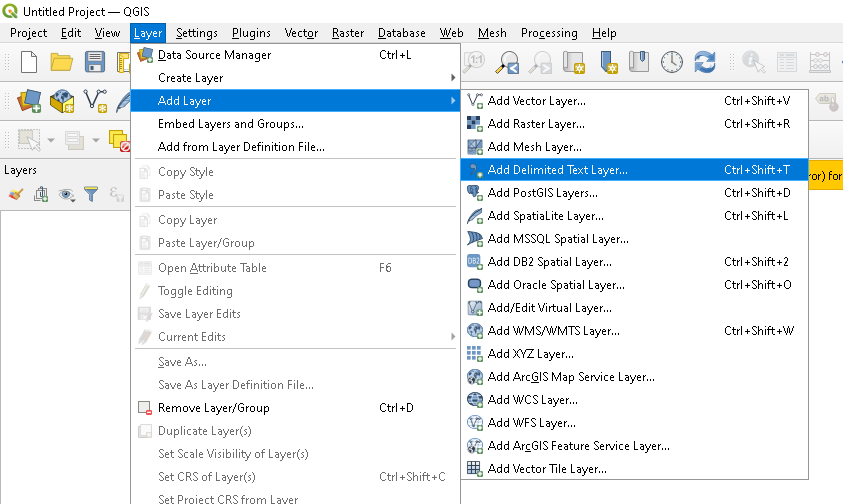
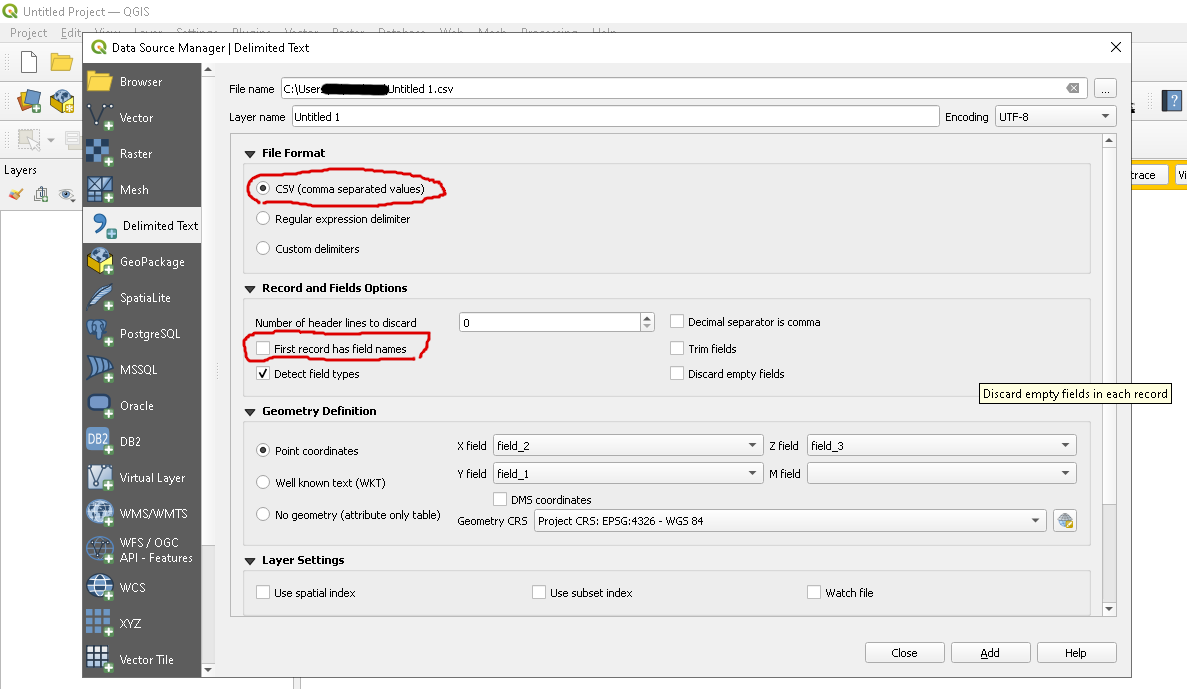
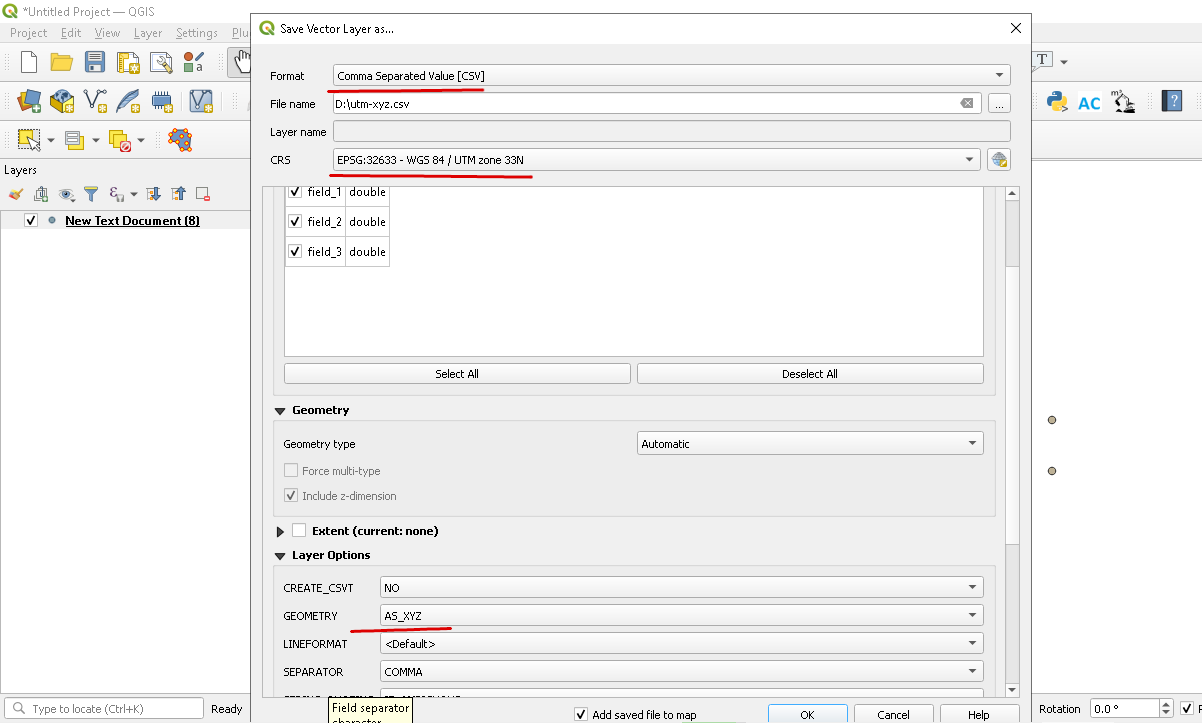
4- Use QGIS to add layer
5- QGIS exports layer into dxf , kml and csv etc
6- Use CloudCompare , FreeCad , Blender and AutoCAD etc for modeling and surface & volume calculation
As alternative
You can use Notepad++ alone to open .POS file
1-Use Alt+CTL+mouse to select xyz columns
2- Copy and paste them in new file
3- Use search–>replace all to replace “space” with “,”
4- Save as csv
5- Import with GoogleEarth (Fie–>import) or open with QGIS (add layer)
However using librieCalc is better because you can sort columns (data–>sort) so you can discard all Q=2 or Q=5 rows
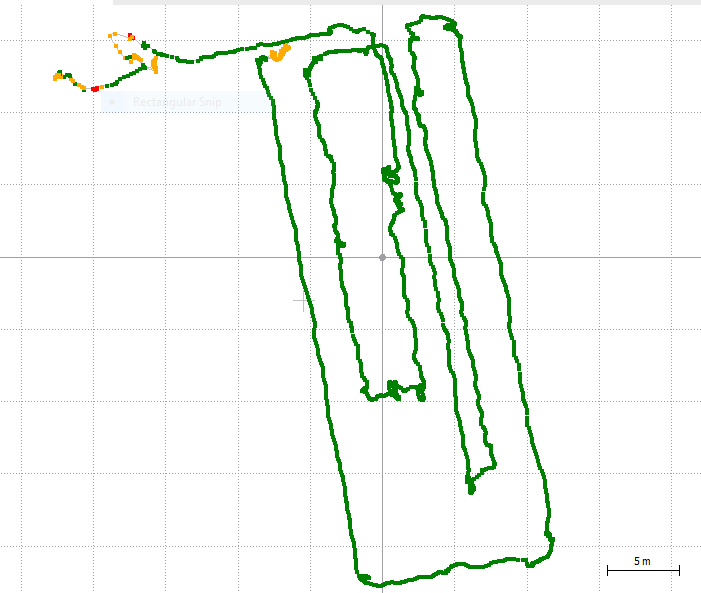
Ok so I have another question about post processing. I have successfully processed some measurements using emlid studio and I got a good result. Here is a screenshot of my readings:
Now, while I was getting these logs I also was marking survey points. In each spot where you can see a little cloud of data points I took about a minute to collect data. Now what I am trying to do is make my survey points an average of the data points from the clouds of data and cut out the rest of the readings so I can put corrected and accurate points into ArcGIS. What is the best way for me to do this? The docs didn’t seem to mention any way of doing this without using RTK. Any help would be appreciated!
This is my way:
1- Open GPS.POS file with LibreCalc
2- Remove unwanted rows and columns (text and blank etc)
just keep LLH columns as it is
3- Save as GPS.CSV
4- Drag and drop into CloudCompare https://www.cloudcompare.org/release/CloudCompare_v2.12.alpha_setup_x64.exe
5- Clean visually and manually using segment tool (scissors tool)
6- Save segmented cloud as GPS2.CSV
7- Import to your GIS software QGIS ArcGIS
Remark:
After segmentation, you lose points order
If the order is important to you, there is a trick to use label in column No 4 ( L , L , H , Lable )
You can visually and manually segment each group of points (survey points ) and save each group in a separate CSV file
then use average function of LibreCalc or Excel
or you can from CloudCompare itself use Tools >> Batch Export >> Export Cloud info
to find averaged XYZ and also the number of you segmented points (survey points)
Aso, you can
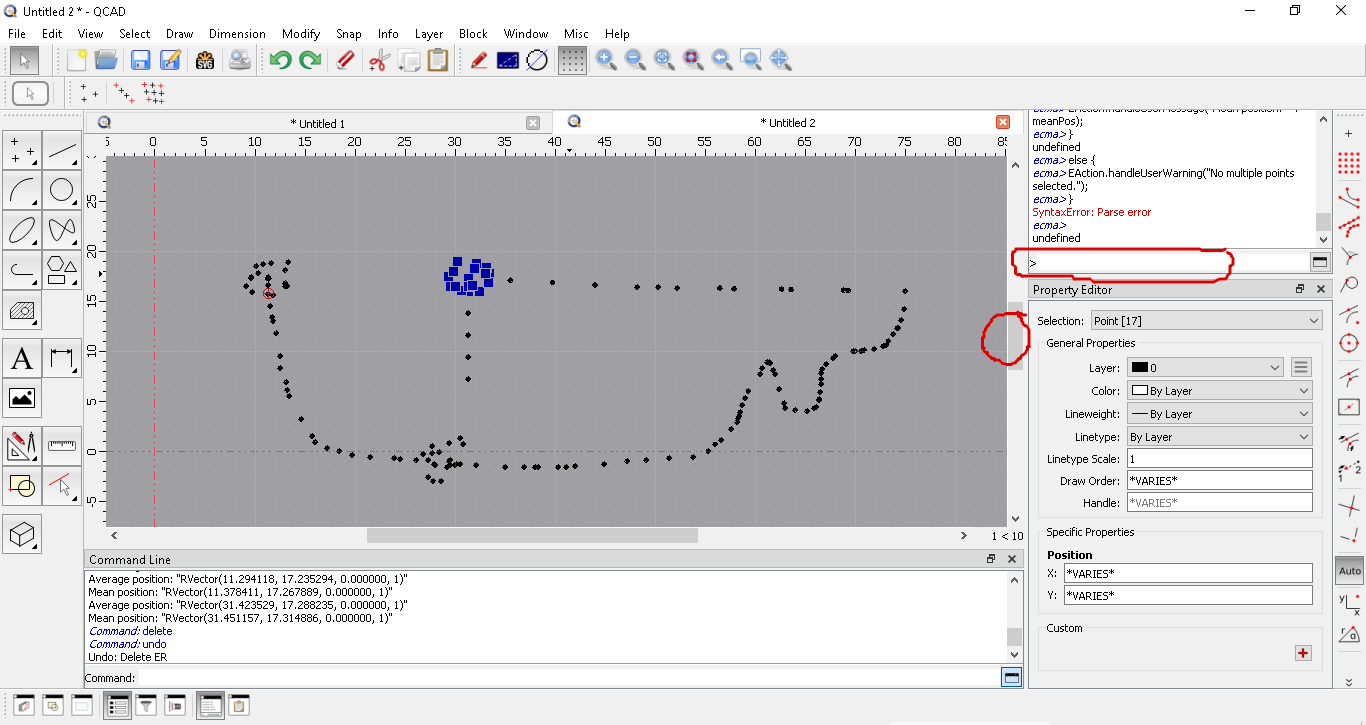
1- Open your points by free QCAD
2- Select one group of points (survey points) and paste javascript into code line
3- Click vertical scroll bar then hit DEL to delete original points
QCAD does not show Z value but preserves Z value during savinfg