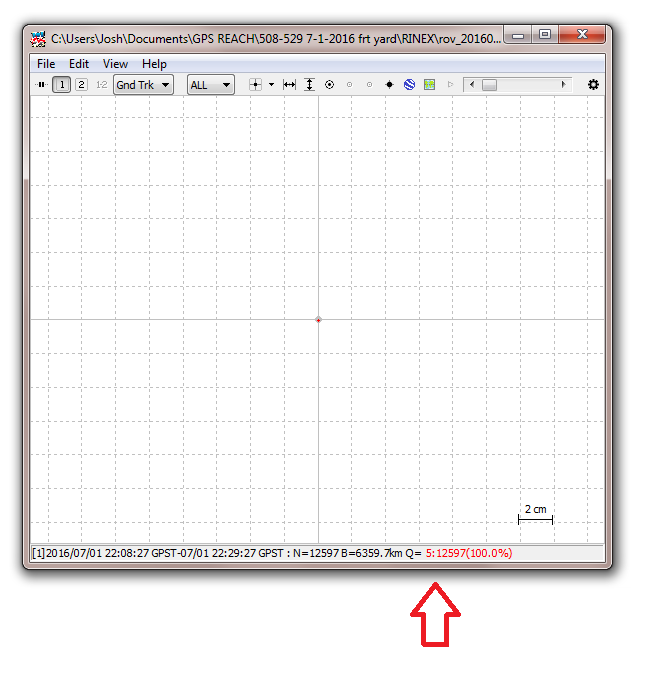
I need help on why I can’t get any plots. I did a log with excellent signal from 5 to 6 GPS satellites (SNR > 45dB) for 20 minutes without moving the Reach, but I always get Q5 with the post process. Both the rover log and the CORS base station seemed to log correct as far as I know:
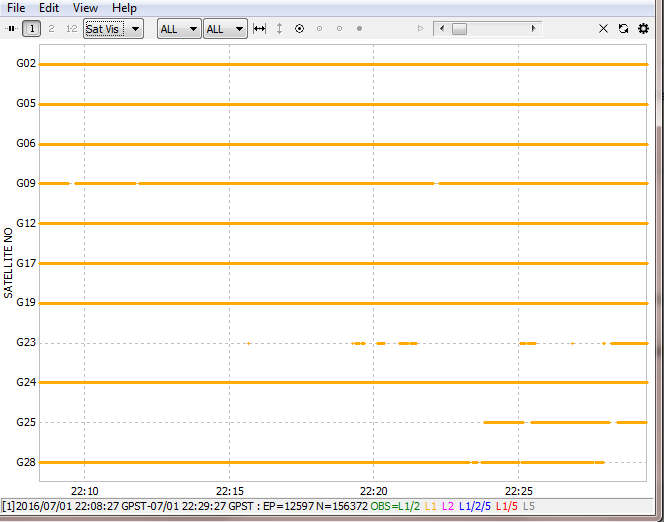
rover has 12597 samples in 21 minutes (sampling at 10Hz)
CORS has 720 samples in 60 minutes (sampling at 0.2Hz / every 5 sec)
So you have 50 rover samples for every CORS sample. RTKLIB would spend 98% of it’s time with no base station info to match your rover sample.
I know there is a base station interpolation setting in RTKPOST.exe, I think under the misc tab. Not sure if that would help, but maybe you could convert your rover data with 5 second samples or maybe set the interval setting on the main RTKPOST.exe page
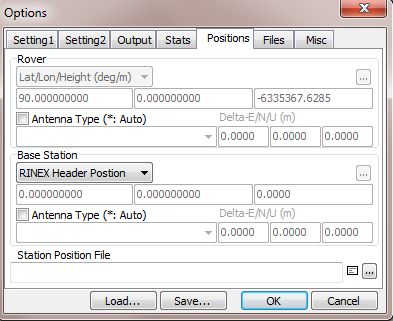
Thanks, I tried both of those things but it still puts out Q=5. The only way I got any plot at all was to click Options > positions > then type in the accurate and known Base station coordinates and elevation, but it was still puts out Q=5 100%:
The only other thing I can suggest is to make absolutely sure your obs data overlaps your rover data in time, and perhaps try “RINEX Header” for your base station position. As you have noticed, RTKPOST isn’t very helpful when it fails, and some simple things like these are easy to overlook.
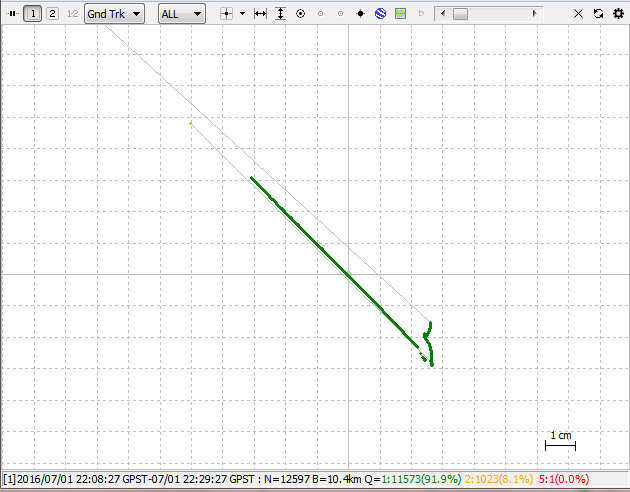
Thanks! I went under the Postions Tab and then selected “RINEX Header” under base station, and I think that fixed it.
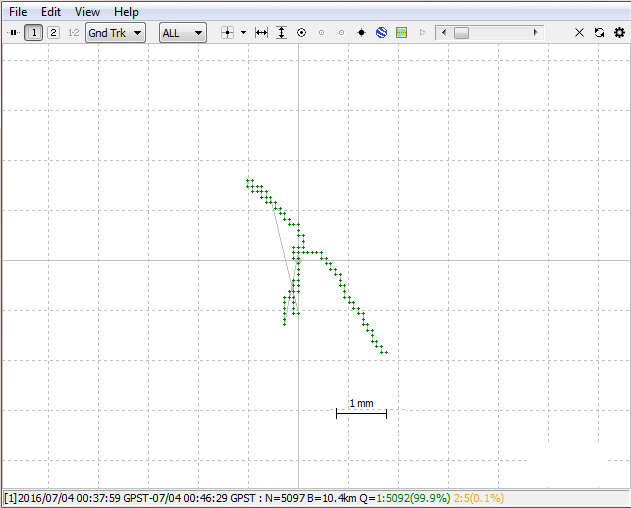
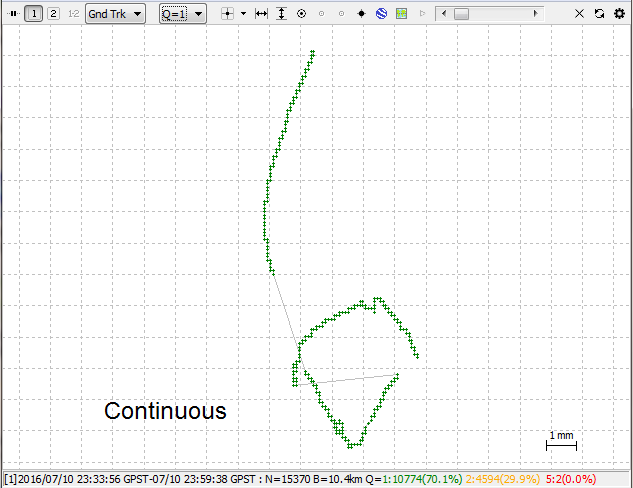
Now I have Q1, But I find it odd though how the Q=1 “fix” is in a 13cm long straight line because I did not move the antenna. I had the antenna sitting on a metal pan. Hopefully it was just the wind that pushed the antenna, or it slid on the slight angle I had the pan at, and is not some kind of wrong settings or error.
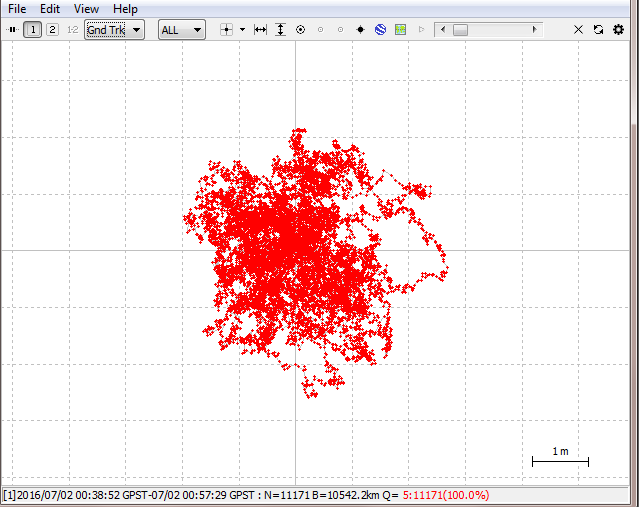
Can you post a screen shot of the positions page? Your second screen-shot shows over 10k samples, all within a 6cm x 6cm area - that’s actually pretty good! How far away is your CORS station?
The CORS station is a little over 10km away. I’m starting to think it might be going in a straight line because I don’t have all of these together: Precise orbit file , Precise clock file, and Broadcast ephemeris. I’m speculating the long plot line might be from the average movement of all the satellites that I got a Q=1 fix by over that 20+ minute period.
The .sp3 Ultra rapid IGS ephemeris file I added seems to not change the plot whether I have it or not. So I must be missing the Precise orbit file and Precise clock file. I don’t know where to get these however.
Personally I doubt it - I have never seen much an improvement when using the sp3 files with a base station (as opposed to PPP), but others may have different experiences.
I meant the position page in RTKPLOT - it would be interesting to see if your positions are clustered in some way or move gradually.
I have had several position files which show these kind of lines, although they usually have a slight curve like the top one. I generally ignore the line if the majority of the fixes are in a small clump.
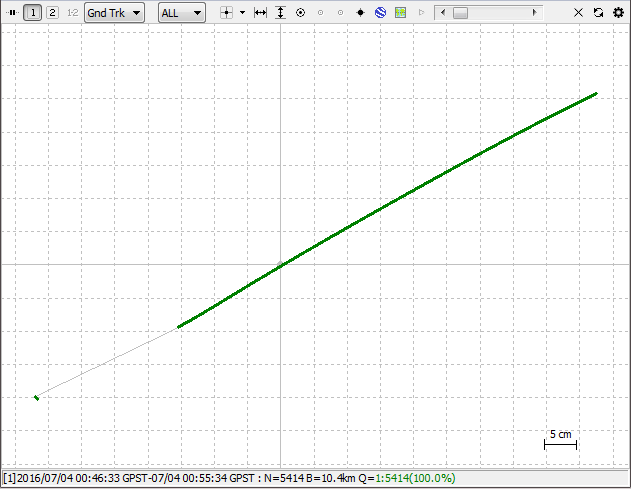
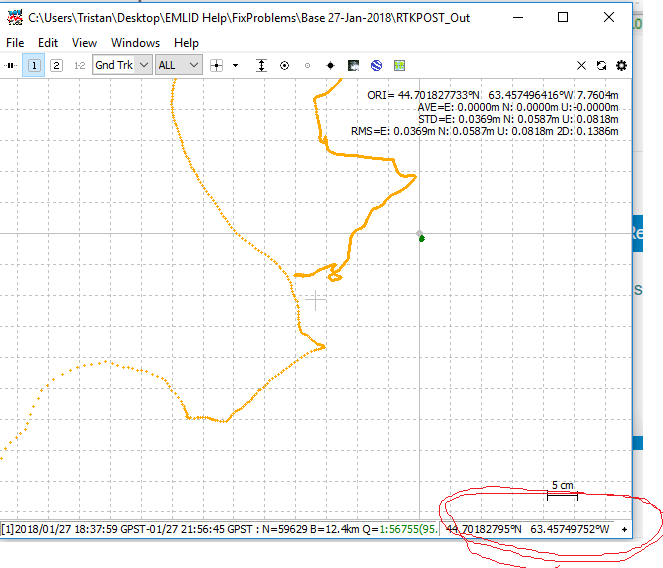
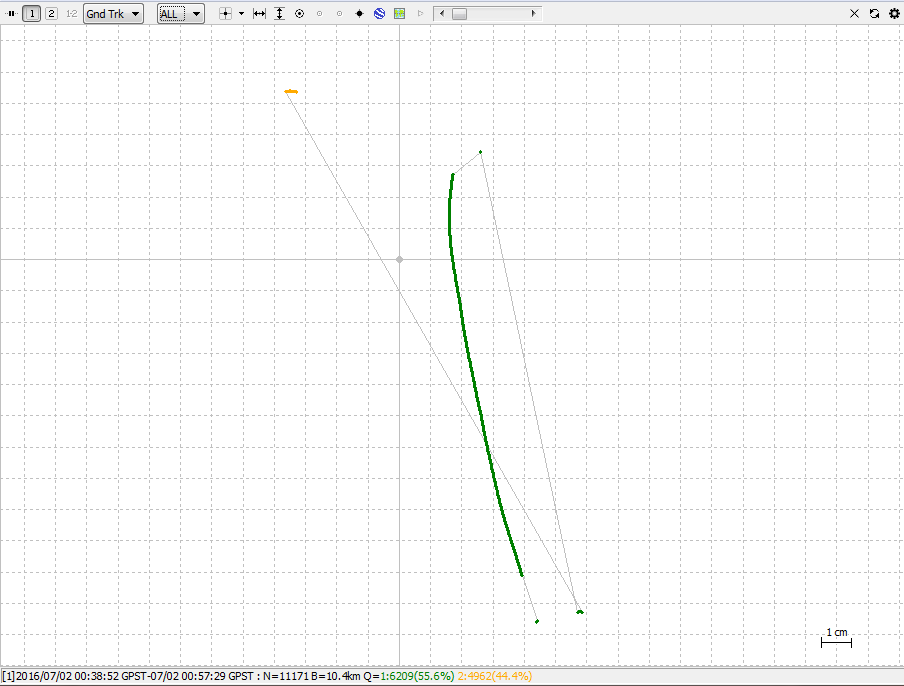
For the most part it’s a very smooth position point movement as seen below, which is odd. Perhaps it’s just slight atmospheric differences and changes between here and the CORS that cause this smooth and and gradual drift.
Here is what the above plot looks like zoomed in with the position points:
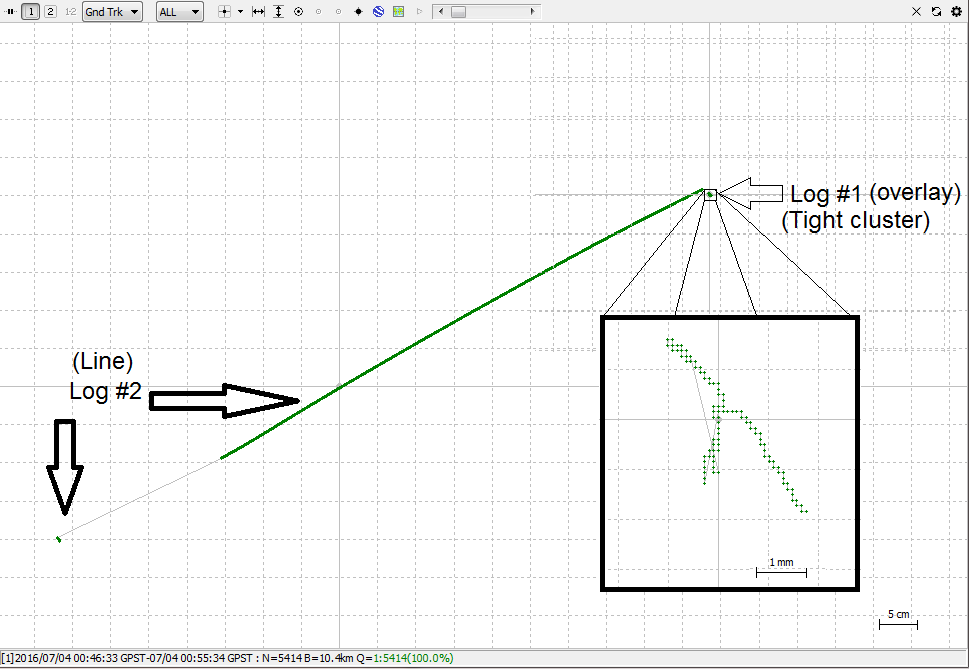
The reason I was confused is poster Steve Zeets said he got within 2cm horizontal and 3cm vertical after 20 minutes of log:
And I don’t know how he got this 2mm accuracy plot that is a tight cluster (no line here):
But I’m guessing the 2cm horizontal and 3cm vertical is likely because he was only 5.1km away from the CORS. But I still don’t know what to think about that 2mm tight cluster plot?
Does he mean all the fixes that are shown in the 2mm tight cluster are accurate to 20mm horizontal and 30mm vertical? Is that determined by the additional fields in the .pos file?
I’m no expert on this and I would also like to know the accepted method behind determining the accuracy of a given position.
The first one which was about 8 minutes of log is an amazing tight cluster of about 4mm. After stopped that first log, I immediately started a new log of about 9 minutes which of course created the odd line plot again. I don’t understand the line type plots, but at least I got one super tight cluster log.
You stopping and restarting makes the Kalman filter restart under different conditions, I suppose. Maybe it was a multipath signal messing up your fix and it wasn’t present (or as strong) the second time. Just speculating.
Sorry @RTK that I didn’t respond sooner. I’ve been in an area with little to no service for a week. The farther away you are from the base (or CORS) the more error you will get. I was only 5km from the CORS base station that I processed with. 10km is at the limit of what L1 GPS can do accurately. You may need longer observations. Also, what did your sky obstructions look like around where you setup your GPS? Send a photo in all 4 cardinal directions of where your REACH was setup. I had a totally clear setup for my test where I achieved the results you are referring.
It looks like you got most of your problems solved already. Let me know if you’re still having issues.
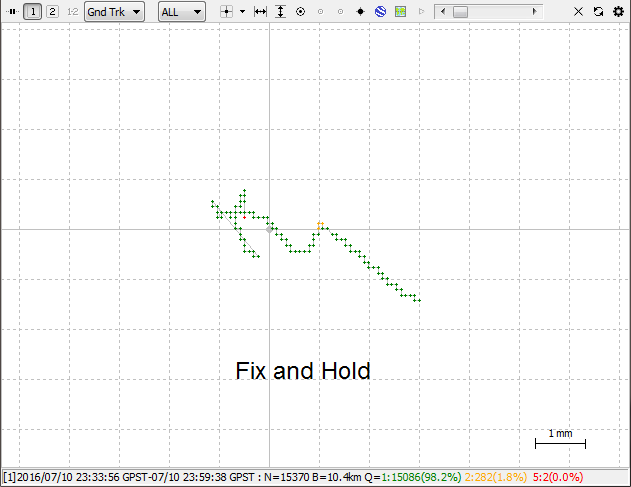
Thanks for the response. I think it has helped since I moved it away from the house some, that’s really the only obstruction I believe. The closest trees are about 50 yards away. Today I got a very good fix that is within 4 mm on Fix and hold setting, even with very thick and cloudy skies. I think that is excellent for being a bit over 10 km away from the CORS base. Moving it away from the house and also creating a very smooth and flat 100 mm diameter antenna ground plane has seemed to help a lot.
This discussion has been very helpful. Thanks everyone.
Does anyone know if there is a way to change the coordinate display in RTKPLOT from decimal degrees to Northing and Easting? I’m just trying to compare the before and after positions for PPK, and it’s much easier to do if it’s all in meters.


 :
: