Hi there, I have read many threads hitting all around this topic, but they always had some outlier detail that could be the culprit. So, I have tried to eliminate those factors in this test. I have been using Emlid for a while and the elevation variation hasn’t been an issue. I am now considering some projects where it will matter so I wanted to remove the elevation variation.
Issue: Repeated Measurements in the same location have different elevations.
Reach Firmware version: 31.8
and Emlid Flow version: 10.7
Detailed issue description. How does observed behavior differ from the expected one?
Expected Behavior: subsequent measurements should have minimal variation.
Actual Behavior: Elevation difference 3.3 inches
Northing and Easting changes as well.
placed the receiver over the PSM with bubble leveled
turned on receiver and waited for it to acquire a fix
Took Measurement 1 (2 mins, 601 samples)
Took Measurement 2 (2 mins, 601 samples)
Picture of the setup or the connection scheme. https://photos.app.goo.gl/zgT74jbiYgVdPGzp9
smartNet NTRIP (measurements in FIX) configured through my phone in Emlid Flow app. Streaming to Rover via wifi hotspot.
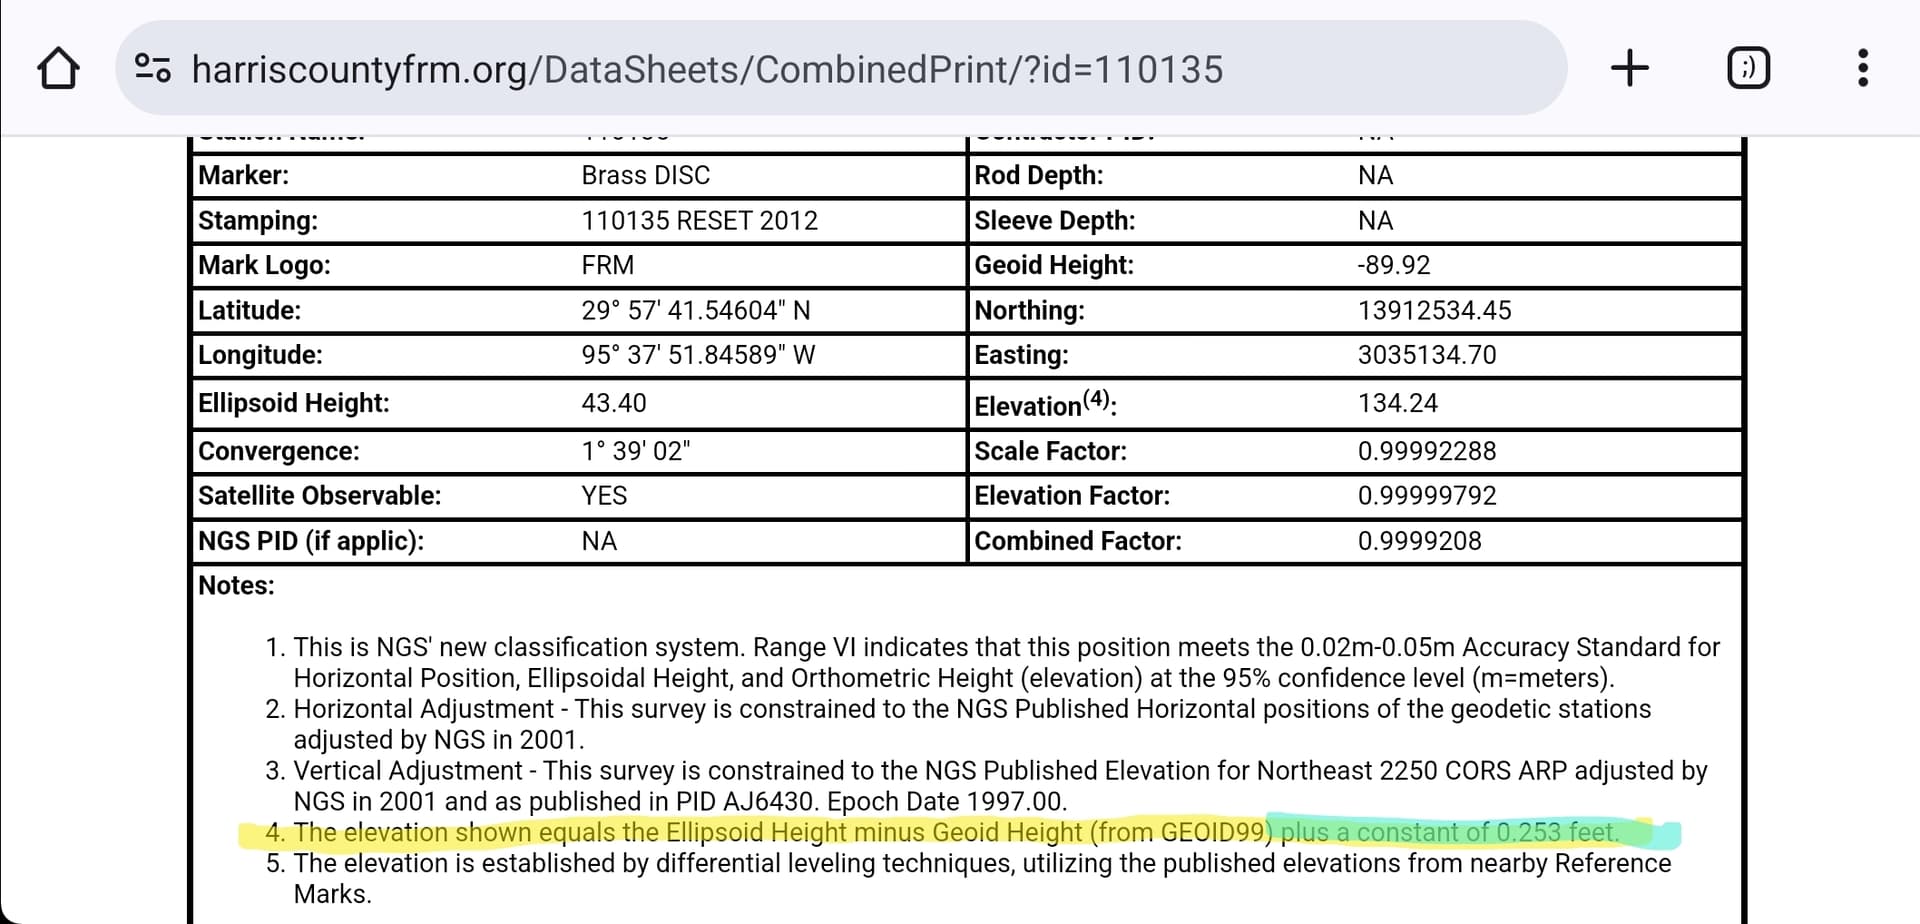
Wonder if this is throwing the vertical off? Different GEOIDS? (GEOID99 vs GEOID18). Additional constant? (What exactly is this? ARP to APC?) Doesn’t quite add up too???
But you mention horizontal issues too? Did the bridge move?
Are your project’s coordinate systems MATCHING the NTRIP’S? Post what your project and NTRIP are using.
I don’t really use Flow as it’s too primitive… but MicroSurvey FieldGenius lets you change (and convert between) GEOIDS and coordinate systems on the fly.
You can download free 30 point limit demos for playing with. You’d be amazed how much you can do with 30 points. I prefer Windows version as fully complete and works with robotic total stations where the Android is still WIP and taking eons to finish. Too many tradeoffs with Android version.
Save yourself a lot of headache and waiting an eternity:
Agreed, first up you need to look closer at your NTRIP source.
It’s all about the base. Reach has proven very accurate and precise in providing differentials to a well-established local base positions.
It could well be doing a great job giving you good differentials to whatever it is you are feeding it.
External NTRIP is a notorious source of issues so check it out, and particularly the CS and datums, and given the extra points below also consider the baseline length.
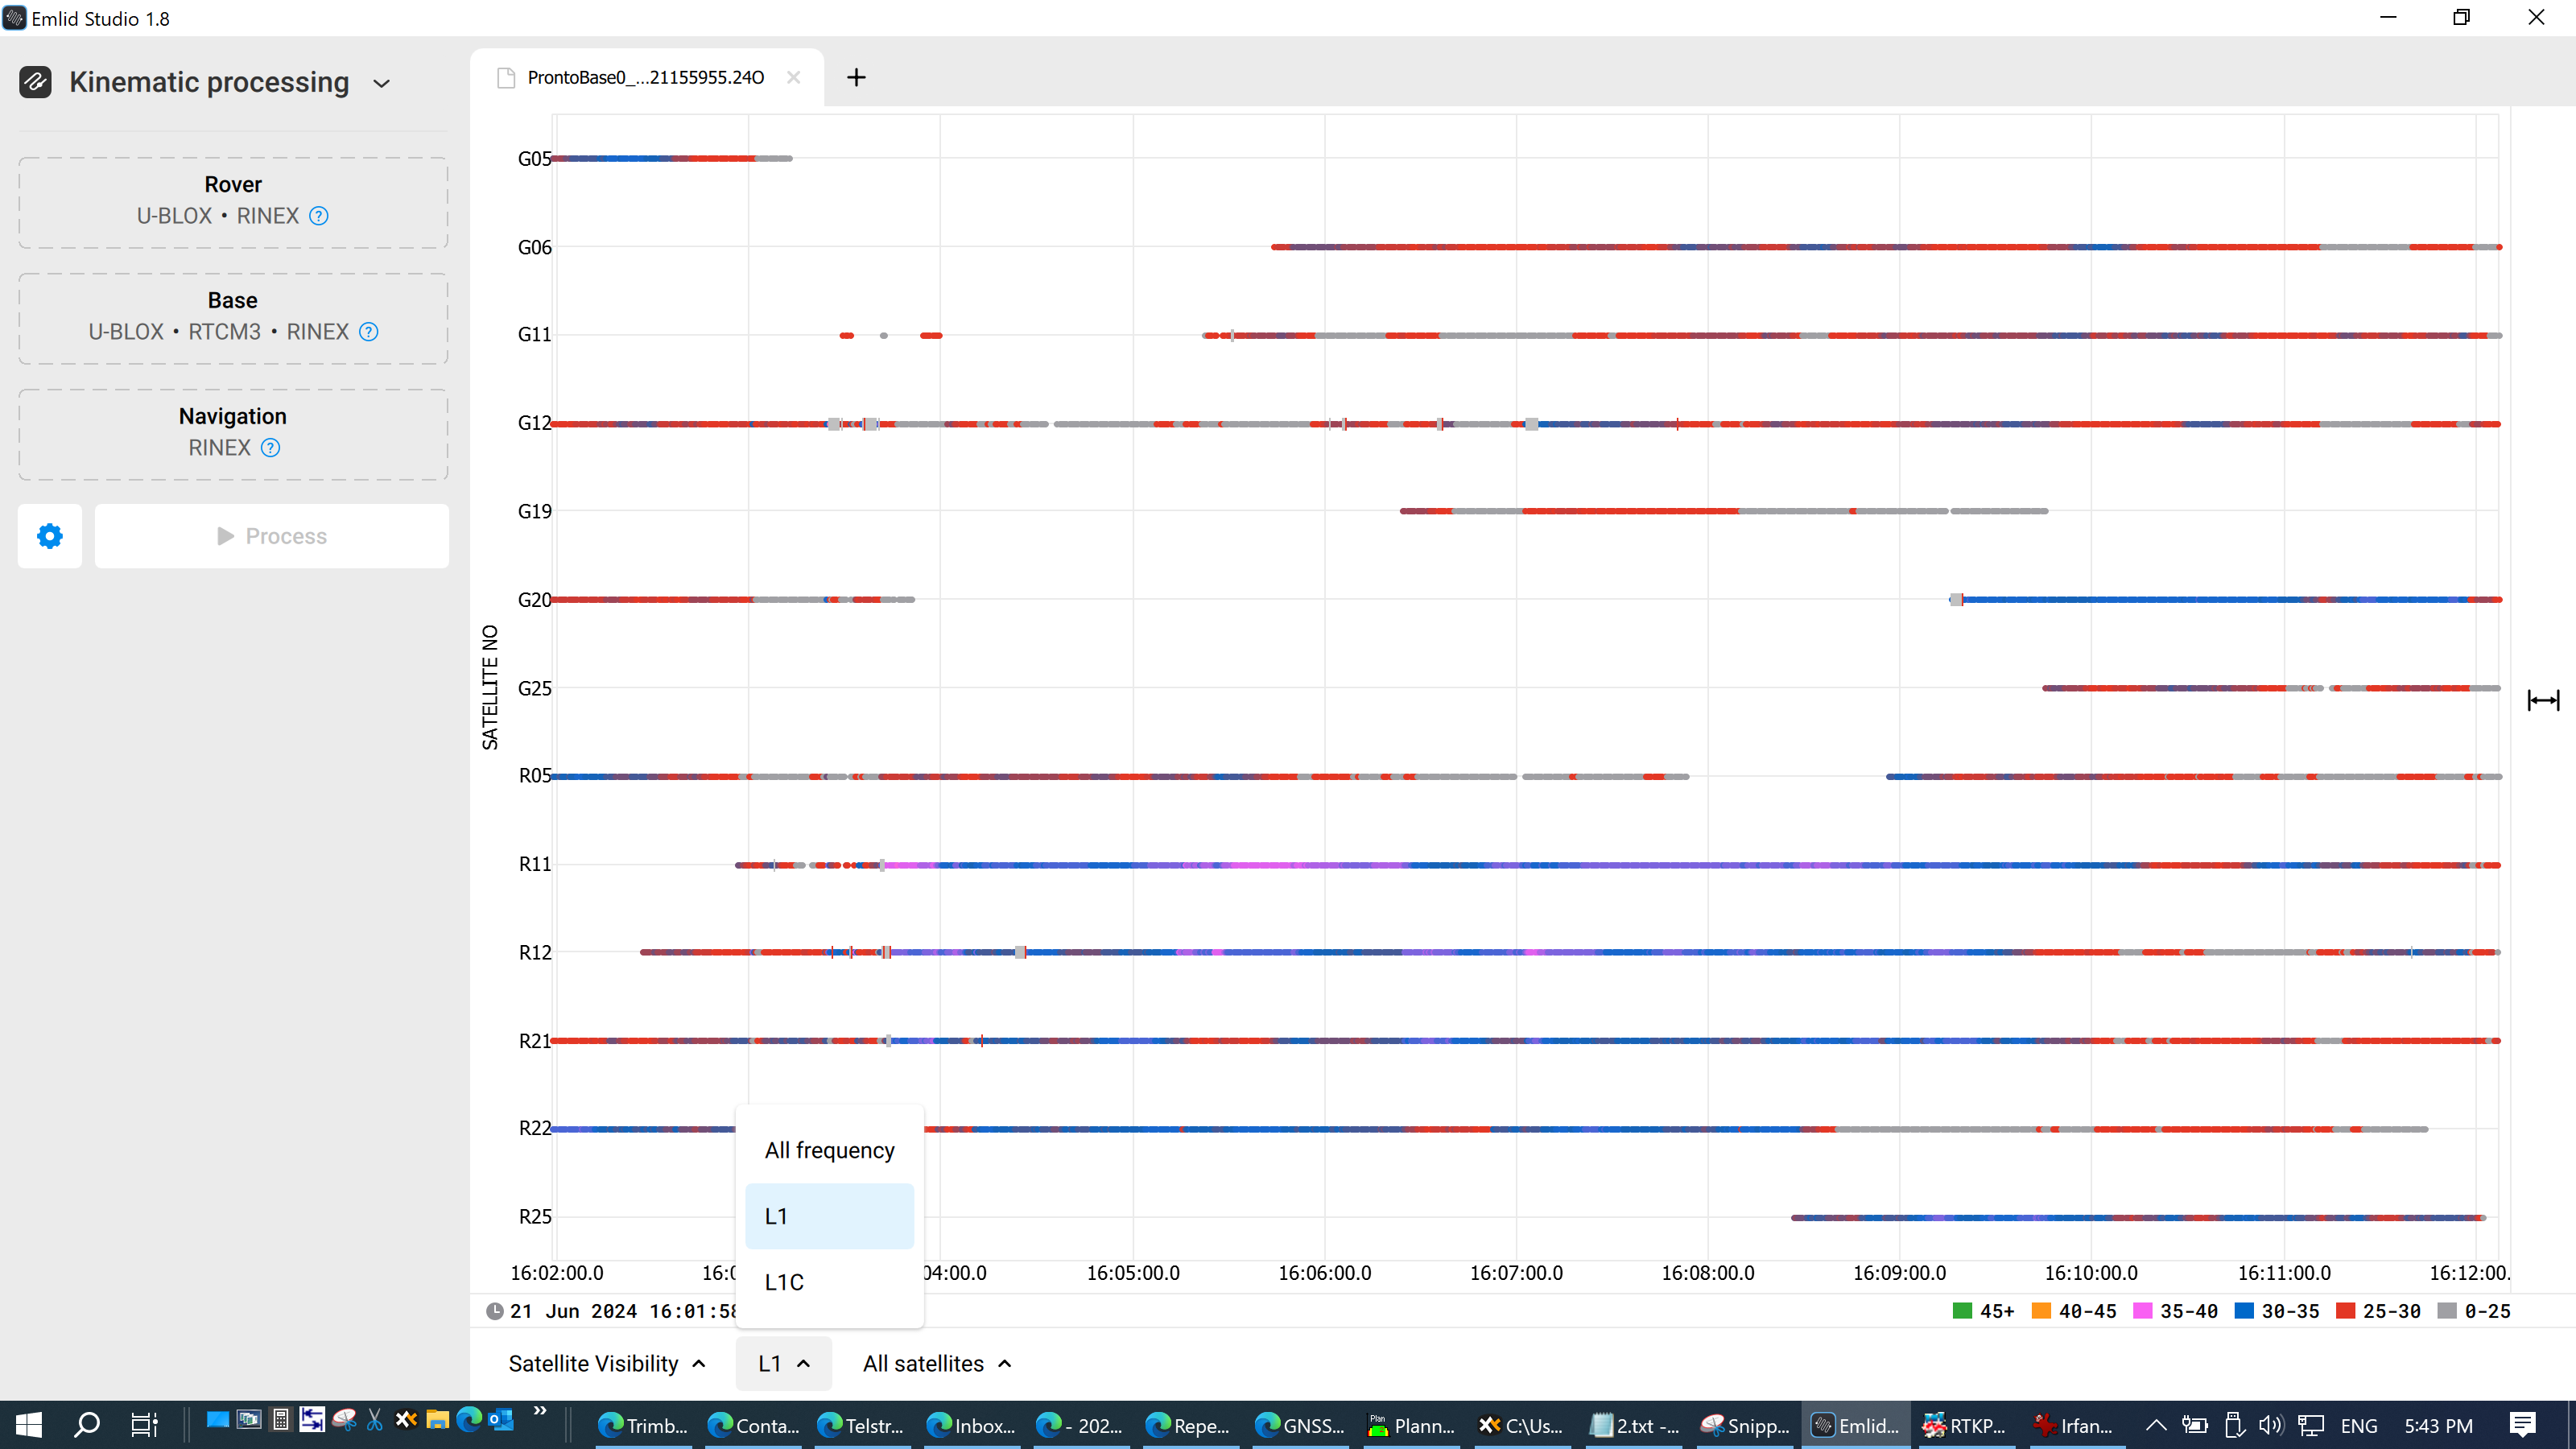
Next thing that stands out is that your observations are very short, the RINEX file is only a tad over 10 minutes max, and with two measurements of only 2 mins each. Thats not very long if you want sufficient data to split hairs on.
And because you appear limited to legacy GPS & GLONASS only in the RINEX file you are only working with between 6 to 9 satellites which is very low, and particularly considering your relatively short observation times.
Hmmm, just had closer look at the RINEX file and I’m now surprised you are even getting as good as what you are. On top of everything else what little exists is also very noisy, and L1 only.
I generally take FEMA benchmark’s s with a grain of salt. They’re not established by any federal/state geodetic agency from my experience. Most of the FEMA benchmarks are established by contractual methods and generally by the firms surveying the profiles if LIDAR isn’t used. I’ve also seen as much as 1’ vertical error in their benchmark’s compared to local passive horizontal/vertical marks.
Most of the newer FIRM’s are related to the current vertical datum but I’ve seen rural counties continue to use NGVD29. FEMA will have a mess on their hands when the new horizontal and vertical datum will be introduced.
Always read the FIRM notes concerning the datum used and verify all FEMA benchmarks either using OPUS or tying into local passive marks
… and why we ALL here appreciate @EBE111057 and are very lucky to have such a professional, knowledgeable and well experienced registered land surveyor here.
Without him and others here like him, @michaelL a lot of us would be wandering around aimlessly. @Wombo seems EXCEPTIONALLY smart also… i am assuming he is a surveyor also, but i do not know. He is also VERY helpful here.
I am NOT a registered surveyor at all, but have worked for surveying and engineering firms over the years. Surveying etc fascinates me and enjoy learning as much as possible about it to help with what I do even if what I do doesn’t require certification like surveying and engineering does.
Honestly, seems to me there should be some sort of certification or accreditation involved in this wide area of gnss measuring to ensure the correct final product.
Well…they’re not actually. If you look at your RMS values in the report, Flow is telling you there is a 65% probability that the heights will be somewhere within 0.106 ft & 0.051 ft respectively, for a combined total of 1.9" apart. That equates to a 95% (2DRMS) probability they will be within 3.8" of each other, and they are so it’s bang on.
It’s giving those RMS values for a reason, to let you know something, and if it’s as high as 0.1ft then there’s a lot of variability it’s struggling with and a red flag something’s not right.
And in this case its because it essentially had two arms and one leg tied behind it’s back hobbling it from doing any better. It was grasping at crumbs to build those results. Your baseline was also over 8 miles so there’s another 0.5" uncertainty. And on top of that nobody knows how good or bad your NTRIP source is and what part that played.
FIX solution is good provided the algorithm is fed sufficiently, And NTRIP as a method of correction is great but ditto re the ingredients. The quality you feed in will 100% decide the quality of your results.
You want to see as many satellites, on as many frequencies, as clearly, and for as long as possible. And your base data has to be impeccable.
So some basic ingredients to start with:
Observe as many constellations as possible, add in Beidou & Galileo
Observe as many bands as possible. Both L1 and L2 is critical.
Observe your positions as long as possible. What are your results worth?
Stay as far away from obstacles as you can, including all those trees I can see in Google Earth. And if you have no choice but to work in a poor environment then multiply all the above accordingly.
And ditto all of the above for your base
Plus
Keep your baseline as short as possible
Confirm your base is accurate, confirm it’s CS & Datum vs the Rover, and confirm it’s trustworthy. And then double check.
Make sure all the constellations are actually included in the correction stream, they can be selected on/off.
Then
For your workflow and technique you will need to provide more detail of your setup and what it is you are trying to do. However some general things you may want to consider:
At each site I would try locate a good established mark, in the best GNSS conditions possible, and as close as possible.
If there isn’t one, then set up your own
Confirm it through OPUS, depending on what you are trying to achieve I would probably give it at least 4 hours or more but will defer to locals for better advice on that as I use AUSPOS here. I would give this observation even more time than you think your data is worth, it’s important.
If you have the gear, establish your own local base there. You know it’s good and the baseline is short. Tick. If you have the coverage you can even set up your own NTRIP.
If you really have to use an external network NTRIP source, then you can validate it against that point.
And every visit record that mark with your rover for confidence nothing has changed, and as a potential life saver to adjust your data if it does. Better still would be having more redundant reference points if you are really serious about it.
It’s actually good you provided the PSM note, it’s a good illustration of why, like the NTRIP, you do need to look deeper to be able to sort the wheat from the chaff to be able achieve the results that you want. So in a roundabout way it actually is part of your question.
Disclaimer: I work in metric so if I’ve messed up the feet and inches stuff I pre-apologize.
Thank you for the detailed response Wombo. I actually had to read that a couple of times to digest it all.
Does someone have a good tutorial on how to setup my own established mark? My reason for going with NTRIP is that I thought I was getting a reliable solution. I understand there is more to it than just getting the FIX.
OK, so today I logged the same point 2 times, with 1 hr sample sizes. I tried to upload the zipped .204 file to opusc(83mb) and it was rejected. It’s already decimated to 30sec.
The difference in the Z readings was 0.48 inches. So, much better.
Is there something I can do to get an opus validation? I have a 2m pole, and opus requires a BAM measurement (bottom of antenna mount) height for emlid rs2+
I think typically 4 hours is OK, but appears about 7-8 hours is optimum. Prob wouldn’t use Rapid-Static. Since 2m pole, 2m to Bottom of Antenna Mount which in this case is also the same at the ARP. After you select the correct antenna, RS3 or whatever model you have, I think it automatically implements the APC (distance from ARP to APC). Search OPUS here for lots of talk and help on things. Search NRCAN also.
I saw the dual frequency requirement, but I don’t know what I need to do to enable that. I have all satellites enabled and am logging in OPUS. I have an RTK connection here that I am receiving correction from.
Not sure what else is going on there & how you may have managed to kybosh L2 without a lot more detail, for starters are you able to upload the latest RINEX file somewhere? And show your configs?
Also, what SmartNet NRTK service (license) are you subscribing to? They have a weird and confusing array of choices from GPS only, adding constellations, adding message types, different network solutions etc. The only thing I didn’t see was adding fries.
That said I just test setup a GPS L1 only NTRIP stream here and attacked an RS3 with it, and as expected it didn’t cause L2 or any other constellations to go AWOL from the RINEX like in your first file.
Ok, today I setup the receiver and allowed it to average for 30 mins (max possible). I then took two measurements at 1 hour each.
The log file is here: ProntoBase0_20240701125509.zip - Google Drive
So yesterday’s file was too large to be processed by OPUS. It was 49 meg zipped; 30 min averaging and then 2 measurements of 1 hour each. I am running the test again today with shorter measurements, but still 30 min averaging to start. I am sending the .24O file with the Emlid RS2+ antenna selected and a 2m bottom of mount (2m pole).
@Wombo , did you get a chance to look at the file to help me understand the L1 / L2 thing?
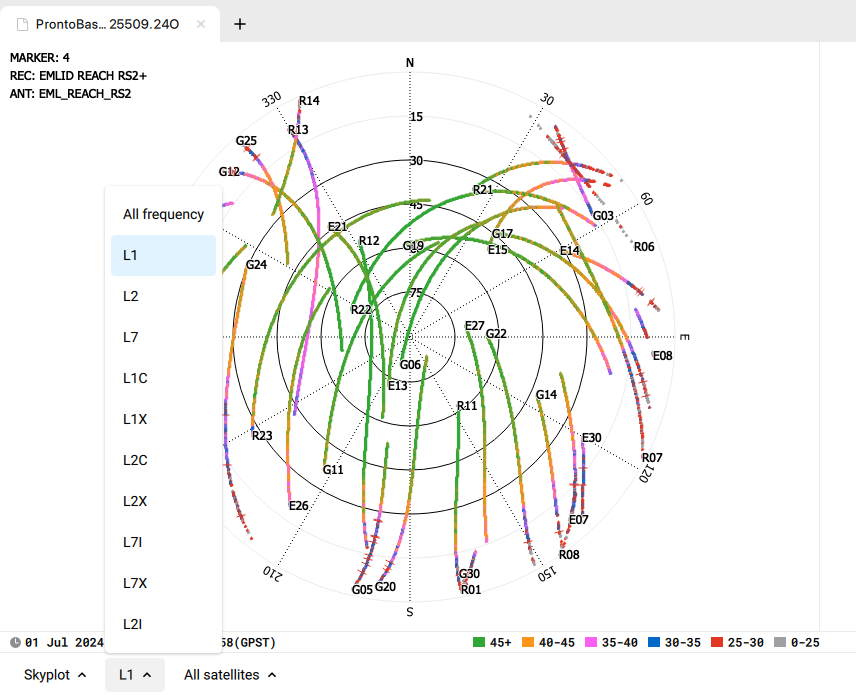
Matthew, I also checked the raw data logs from your receiver. In the second case, more constellation was enabled, and L2 was also used. There are some lower-quality logs, but they’re mostly from satellites near the horizon.
In the original setup, based on the raw data, the receiver saw a low number of satellites, which can affect the accuracy.
I’m attaching our guide about the workflow to get accurate coordinates from OPUS. For the best accuracy, let’s record the raw data logs for at least 4 hours. Regarding the antenna height, you need to add the height of the bottom of Reach on the OPUS site.
This time the upload to OPUS was successful. I extracted just the .24O file for the upload to OPUS.
Here’s the email response I got from OPUS:
FILE: ProntoBase0_raw_20240702124414.24O OP1719930486225
2005 NOTE: The IGS precise and IGS rapid orbits were not available
2005 at processing time. The IGS ultra-rapid orbit was/will be used to
2005 process the data.
2005
6029 After the single baseline analysis, fewer than 3 useable
6029 reference stations remain. Aborting.
6029