I completed a PPK survey the other week with a single RS2 rover. Base station data was pulled from a nearby NRCan station (7km away). I completed the PPK using RTKPost (demo5 b31). In the field we were surveying in support of a seismic survey, so collecting points in ReachView Survey (latest version), using about 20 - 30 seconds time on each point (single, no RTK) and exported everything to CSV. Logged Rinex3.03 directly in the RS2 for PPK. Now when trying to use the CSV of survey points from ReachView to parse out the correct location from the PPK result I’m seeing a mis-alignment.
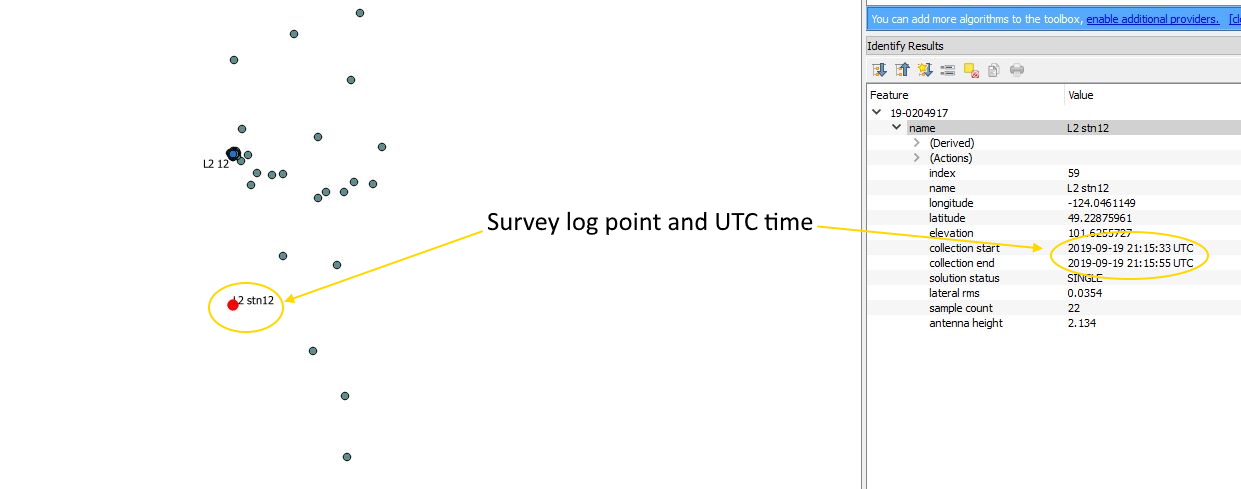
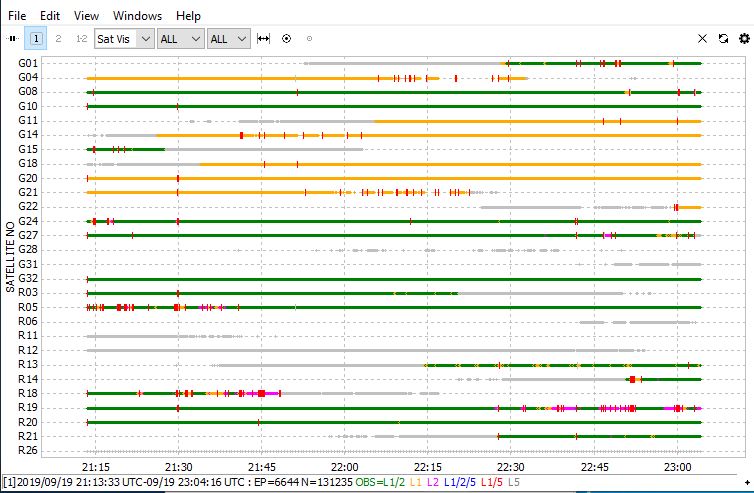
For parsing I’m using the UTC time, by converting to total seconds in the day, to align the proper station label (from CSV) to the correct geographic location from the PPK results. However I’m noticing a 1 - 3 minute time difference in the time reported in ReachView Survey and the time reported in the PPK log. I made sure that I didn’t accidentally post process using GPST. See attached:
Not sure I understand your issue correctly. May I ask you to explain how you come to the conclusion that these two points on your screenshots should be the same point? Were you physically at that point at that time period?
Do you observe the same time shift for all points? This mis-alignment is indeed rather big and looks like something is not taken into consideration during conversion or post-processing.
This data set was in support of a seismic survey for georeferencing the seismic results. Each station represents the location of a geophone sensor, so the order and spacing of the stations is well defined and known. The time from Survey CSV is consistently behind UTC time from PPK result, however the time shift magnitude doesn’t appear to be consistent for the entire day.
Maybe I need to elaborate on my field data collection method:
Survey rover (RS2) collects a ~30s stationary observation at a geophone station using ReachView.
Observation point name is labeled the same as the geophone station name.
Survey rover moves to the next geophone station and repeats the ~30s observation until all stations are surveyed.
Field data was Single Point, uncorrected GNSS.
Survey rover is also logging raw GNSS (RINEX3.03).
geophone spacing was 1m, however GNSS observations were collected every 12th station.
Post processing workflow:
PPK of RS2 rover log completed using RTKPost with base station observations provided by a nearby government operated observatory.
import rover PPK result (ASCII CSV) from RTKPost into Microsoft Excel
For each PPK data row calculate new column of the total UTC time in secords IE: Hour x 3600 + Min x 60 + Seconds = total UTC time (sec)
Sort rover PPK results to increase in UTC total time
import Survey CSV (from ReachView) into Excel
from Survey CSV data set calculate total UTC time (sec) for ‘collection start’ column using the same formula as above
create another column using ‘collection start’ total UTC + 5 sec
this ensures the time point being referenced occurs within the 30s field observation window
use Survey rover ‘total UTC time + 5 sec’ as the lookup criteria with the VLOOKUP function to match the associated Station label from Survey CSV with the correct X, Y, Z values from PPK result
When the extracted results are plotted in QGIS against the single point field survey results, the extracted results are not positioned correctly. Some stations appear in the wrong order for example, station 6 is positioned where station 12 should be. Some stations are positioned at nearly the same X, Y position when they should be separated by ~12m. I also noticed that the final station of the day had no result in the extracted data set because of the time shift between PPK and Survey CSV.
However, may I ask you what you mean by “field observation window”? Why is it necessary to add those 5 seconds? Have you tried matching without adding them?
I’m adding 5 seconds to the Collection Start Time so that the X,Y,Z position being selected is within the point observation time frame. I want this time/position as it is the best chance of capturing a time/position where the receiver is stable.
I haven’t attempted to use either the Start or End time only.
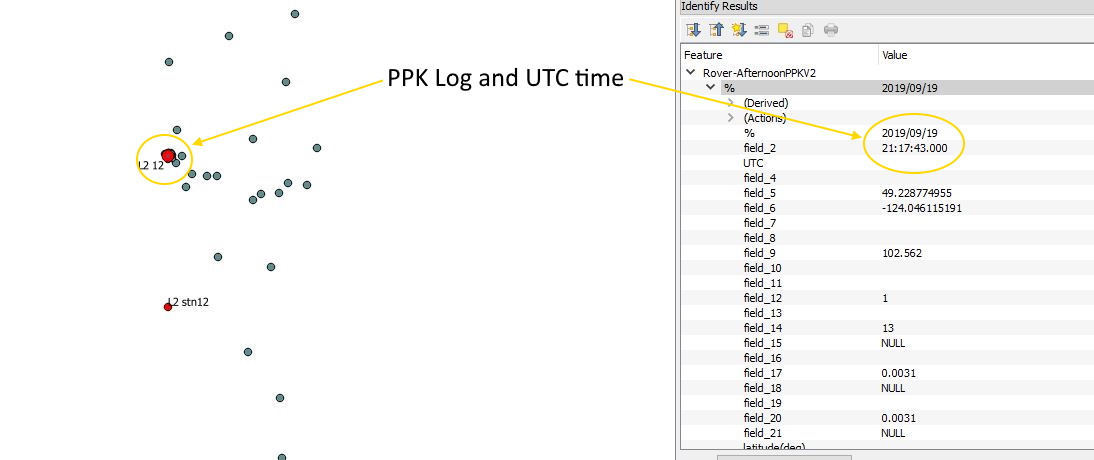
Sounds good Polina. One thing I should mention is the time shift is observable in the LLH data as well, so this isn’t a result of PPK. The pictures below are screen shots showing raw LLH data in purple and Survey CSV result in red star.
This picture shows the time stamp for an adjacent point from the LLH file (21:16:16).
The resulting time difference is slightly less than 3 mins. Of note the timing from the Survey CSV file appears to always be behind the raw file timing. I suspect the problem lies in the Survey portion of the ReachView app, specifically when the user switches to another app on the device and then comes back to the ReachView app at a later time. I noticed that the ReachView app will launch immediately back into the Survey project tab (if that’s where the user left initially), so perhaps the UTC time stamp in the Survey project is not updating when the user re-engages the ReachView app resulting is ‘lost’ time in the Survey CSV file.
I’m afraid I can’t understand how you compare this data.
Both CVS and LLH data sheets in you case, as far as I understand, were obtained in a single mode. It means that the accuracy of these measurements is meter-level. Also, CVS file from the Survey tool is a list of averaged positions during the time period stated in the file, in which you collected the point.
It means that all of the coordinates of these points are going to be different. The way to correlate the points you’ve collected in single mode with the post-processed data is through the time of the start and the end of collecting a point.
In RTKPlot, to get the position of the post-processed points, you should do the following:
Choose “Edit” -> “Time Span/Interval” and set the start and the end time of collecting the point.
Choose “Edit” -> “Options” -> “Coordinate origin” and set “Average pos” to get the averaged position of the point you collected.
To see the averaged position, you can look up ORI coordinates on the “Gnd trk” tab. This is what you can use as the point coordinates.
May I ask you to follow these steps and check if there are any issues with importing them to the QGIS?
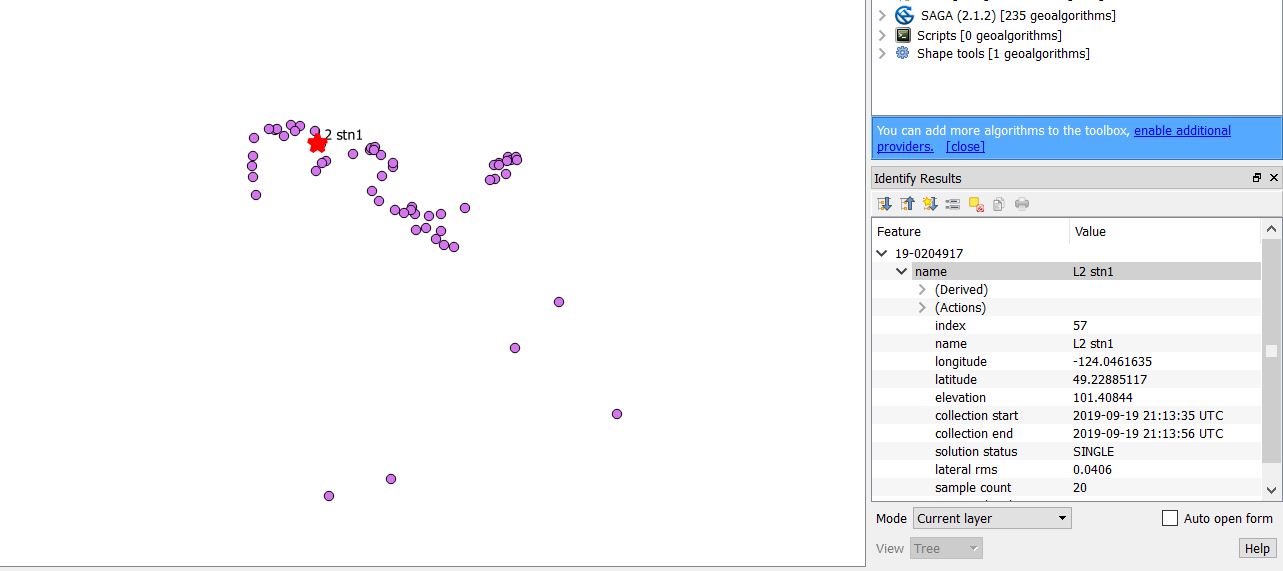
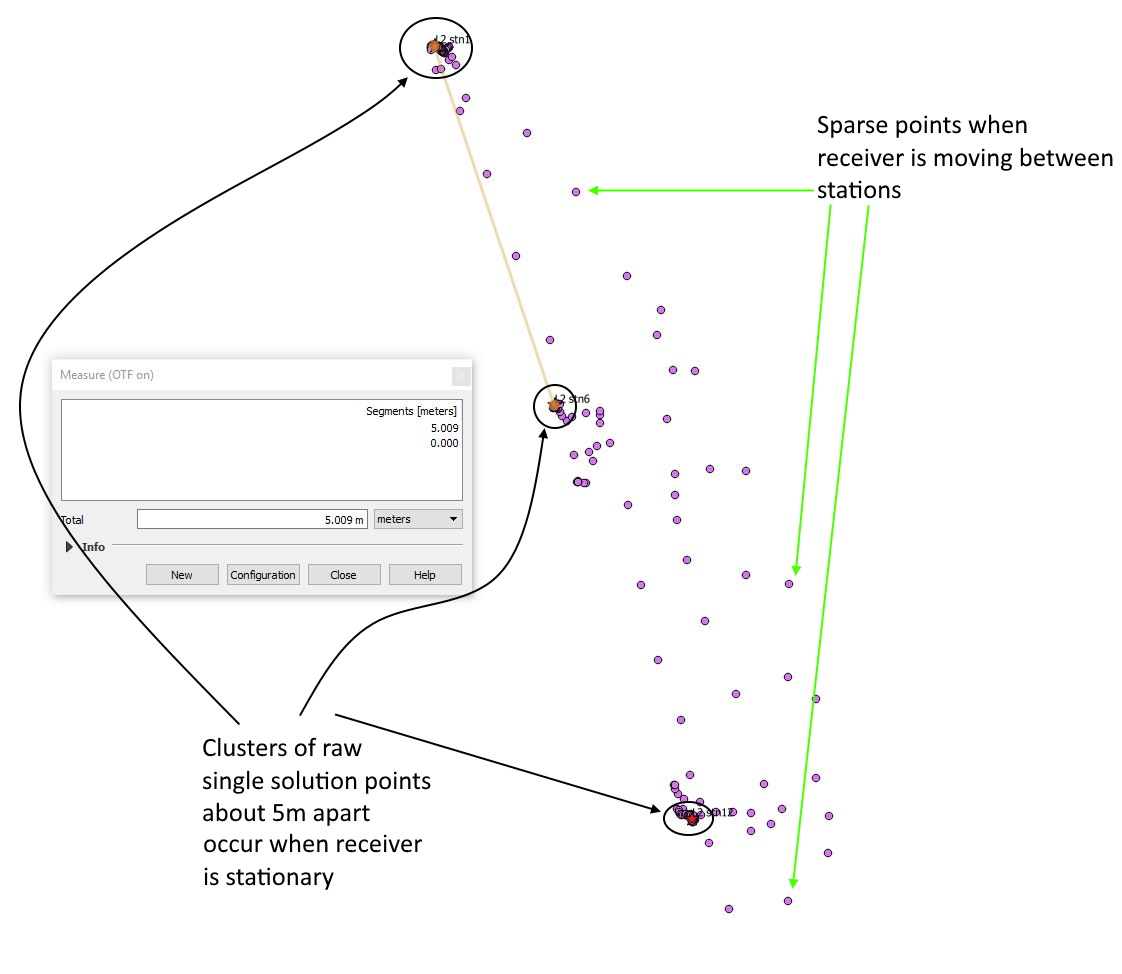
Perhaps I need to clarify that those images above show a tight cluster of points (purple) within a 1-1.5m radius. Below is another image of the data at a larger scale, again single solution LLH (purple) and averaged point from Survey CSV (red star). The surveyed stations were approximately 5m apart and you can see in this image the clusters of purple LLH points surrounding the resulting averaged survey point (red star). In the field the operator is walking the receiver to the geophone station, performing a 30s observation, then walking to the next geophone station 5m away. I’m comparing the time stamps from the LLH points that cluster around the survey point and noticing a time shift of several minutes. Have you been able to look at the data I submitted to Tatiana?
changed the content because I realized that I might have the same problem.
Can you make a manual protocol to compare it with the observation time span?
This would be a huge problem for my post processing script.
I actually also have a case where I had to move the observation time by 45 seconds to get a fix. I could see the same thing as you have seen.
Its actually a desaster because its a master thesis with several hundered measurements and now I understand why some of the points have a terrible ar ratio. Probably they are all misaligned.
Now I’m back in the time where the survey did not include starting and ending times. I started to write a script which uses the result of kinematic ppk to find the beginning and end of a survey point by the clustering of the points. I guess I have to continue with that approach.
Its just an idea to prove that the issue is existing. Write down the start and end time of each point on a paper during a new survey. Just to compare and to have a reference which is independent of the device itself.
I have to go to the field tomorrow, so if I find the time I try to do it. This could also include a comparison of points where the app is not left and points where the app is left and reentered. I guess that is the problem, even if I do not understand why since all important stuff is runnning on the Reach device and the app is simply a browser… .
As far as I can see, the issue in this analysis of the data lies in the way you identify the points that cluster around the survey point.
Please note that both these data sheets were collected, as you have reported, in a single mode. It means that the accuracy of these measurements is meter-level. So, technically, the points you claim to surround the survey point may be from the measurements of another survey point.
For example, the purple points surrounding the L2stn1 survey point on your picture could be actually recorded several minutes later than the survey point and later were averaged to become the L2stn6 survey point. That’s why there is a difference in their time - they belong to different measurements.
That could also be the reason why the PPK data and the CVS data from the Survey project have a time shift between them: you compare the meter-level accuracy coordinates with the centimeter-level ones. It means that you could have compared different points that, indeed, have different observation time.
Let me sum up the issue. I’m afraid I still can’t fully grasp it. Unfortunately, during the month-long discussion, some points might have slipped from my attention.
Below I’ve described the issue as I understand it. Would you mind showing me where I’m missing a point or understand the issue wrongly?
You have a determined set of coordinates of geophone sensors. You attempt to collect these known coordinates with the Reach RS2 base and rover setup.
You start logging once you turn on the devices. Then you collect the points in the Survey project with the Survey tool in standalone operation.
After the survey, you post-processed the logs with the workflow you’ve described several messages earlier. After post-processing, you compare the result of post-processing with the set of the known coordinates and the Survey project data. May I ask you to share the set of known coordinates as well?
When importing the data in QGIS, it’s possible to observe that the points’ coordinates averaged after PPK do not have the same time start and time finish as the ones collected in a single-mode. You determine that you compare the same points by how close the points are to each other.
Also, you observe that the post-processed points do not fall into the same places as they have to according to the previously known coordinates. They appear in the wrong order and are generally not positioned correctly.
Moreover, it’s possible to see the time shift between the time start of the Survey project and the LLH log. The first point is collected before the LLH log starts even though it’s not how it happened on the field. While you compare the Survey project and the LLH log, you also see that the points are not positioned correctly according to the averaged LLH values.
Please, confirm the steps I understand correctly. I’d appreciate your comments on my message to help clear this issue up.