More functions and better usability request for Emlid Studio

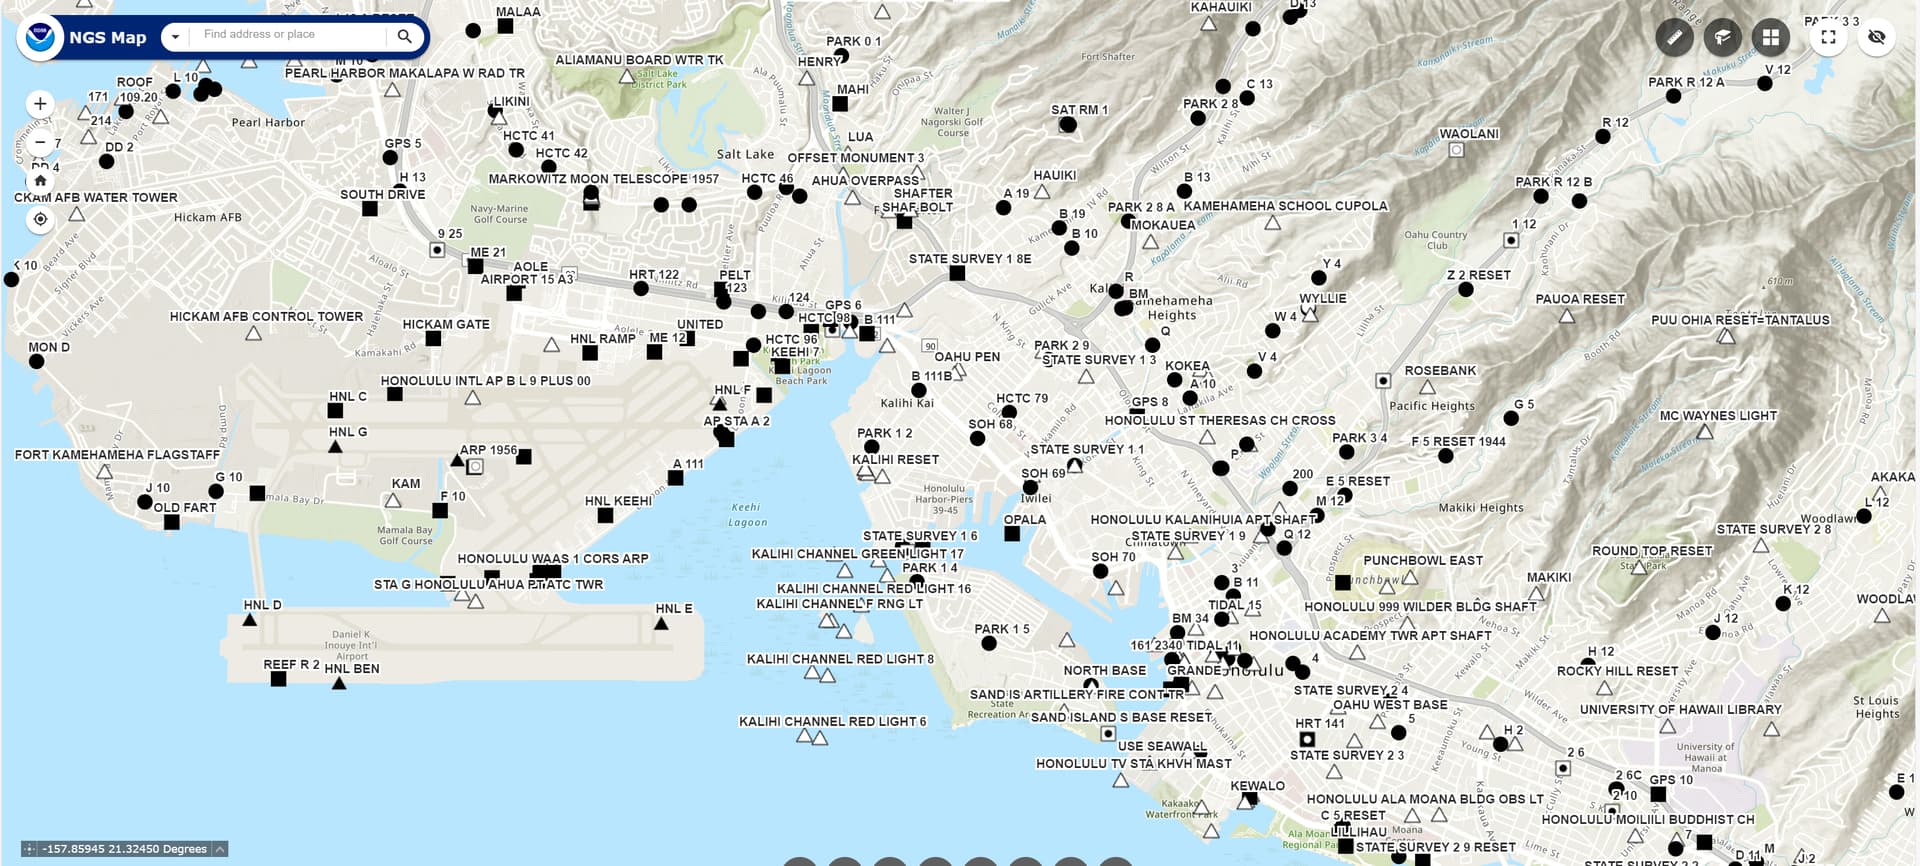
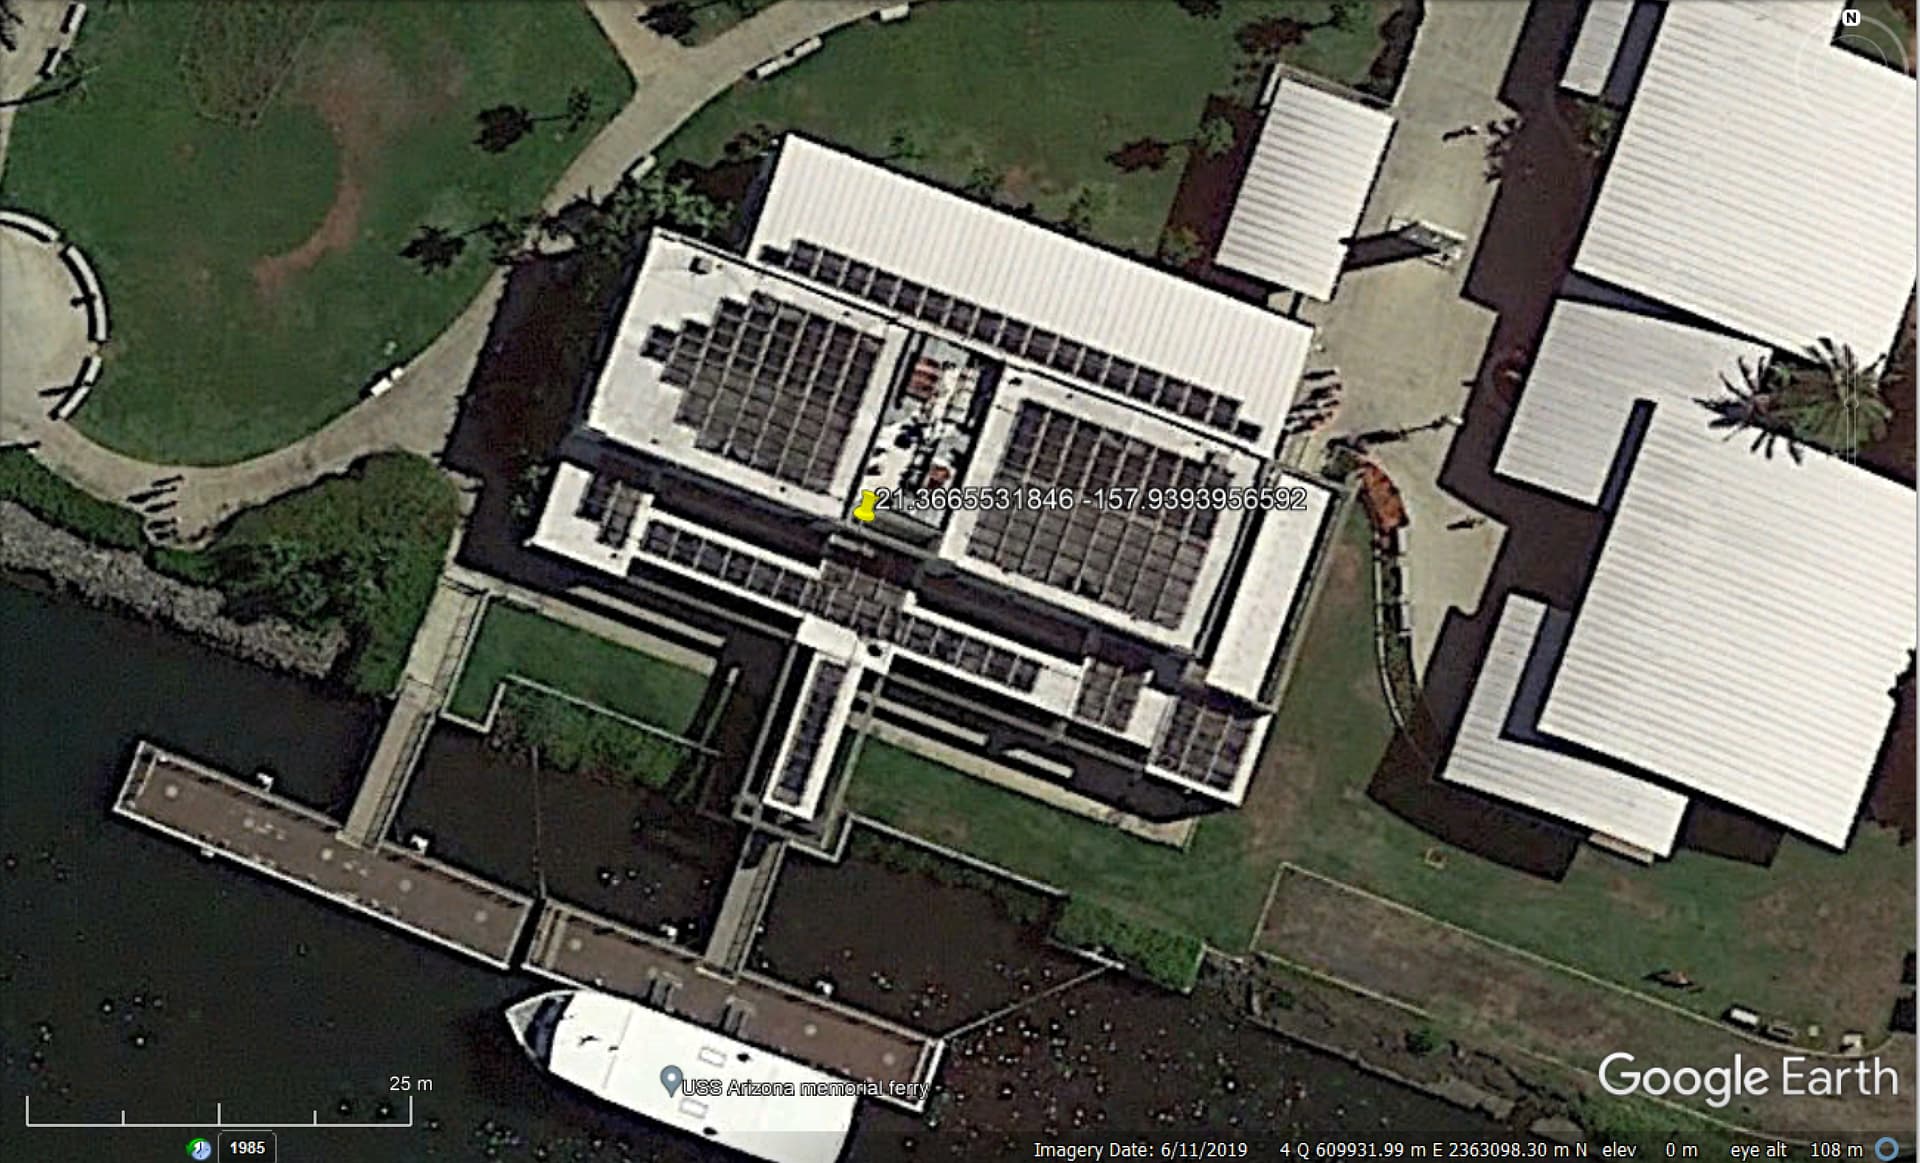
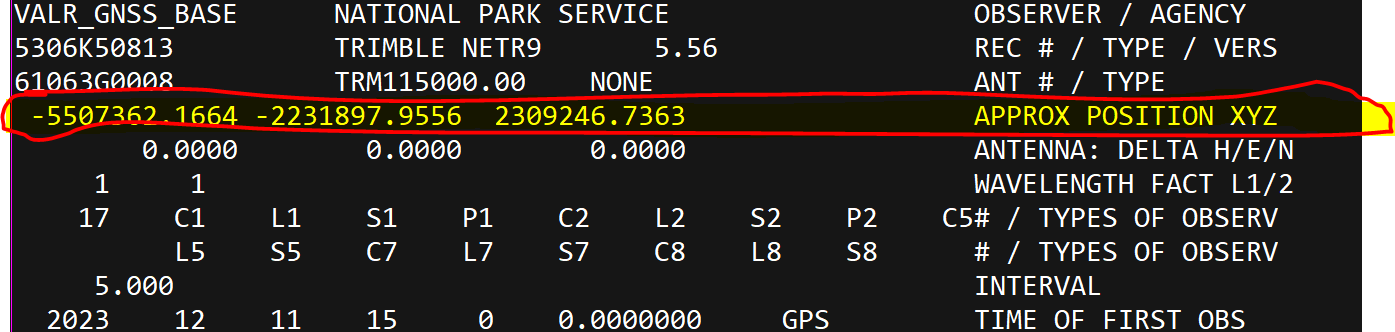
Hello, I’d like to make a feature request. I recently got an RS+ to create ground control points for drone photogrammetry. I’m using PPK with a base station here on O’ahu, the Pearl Harbor VALR station run by the National Park Service.

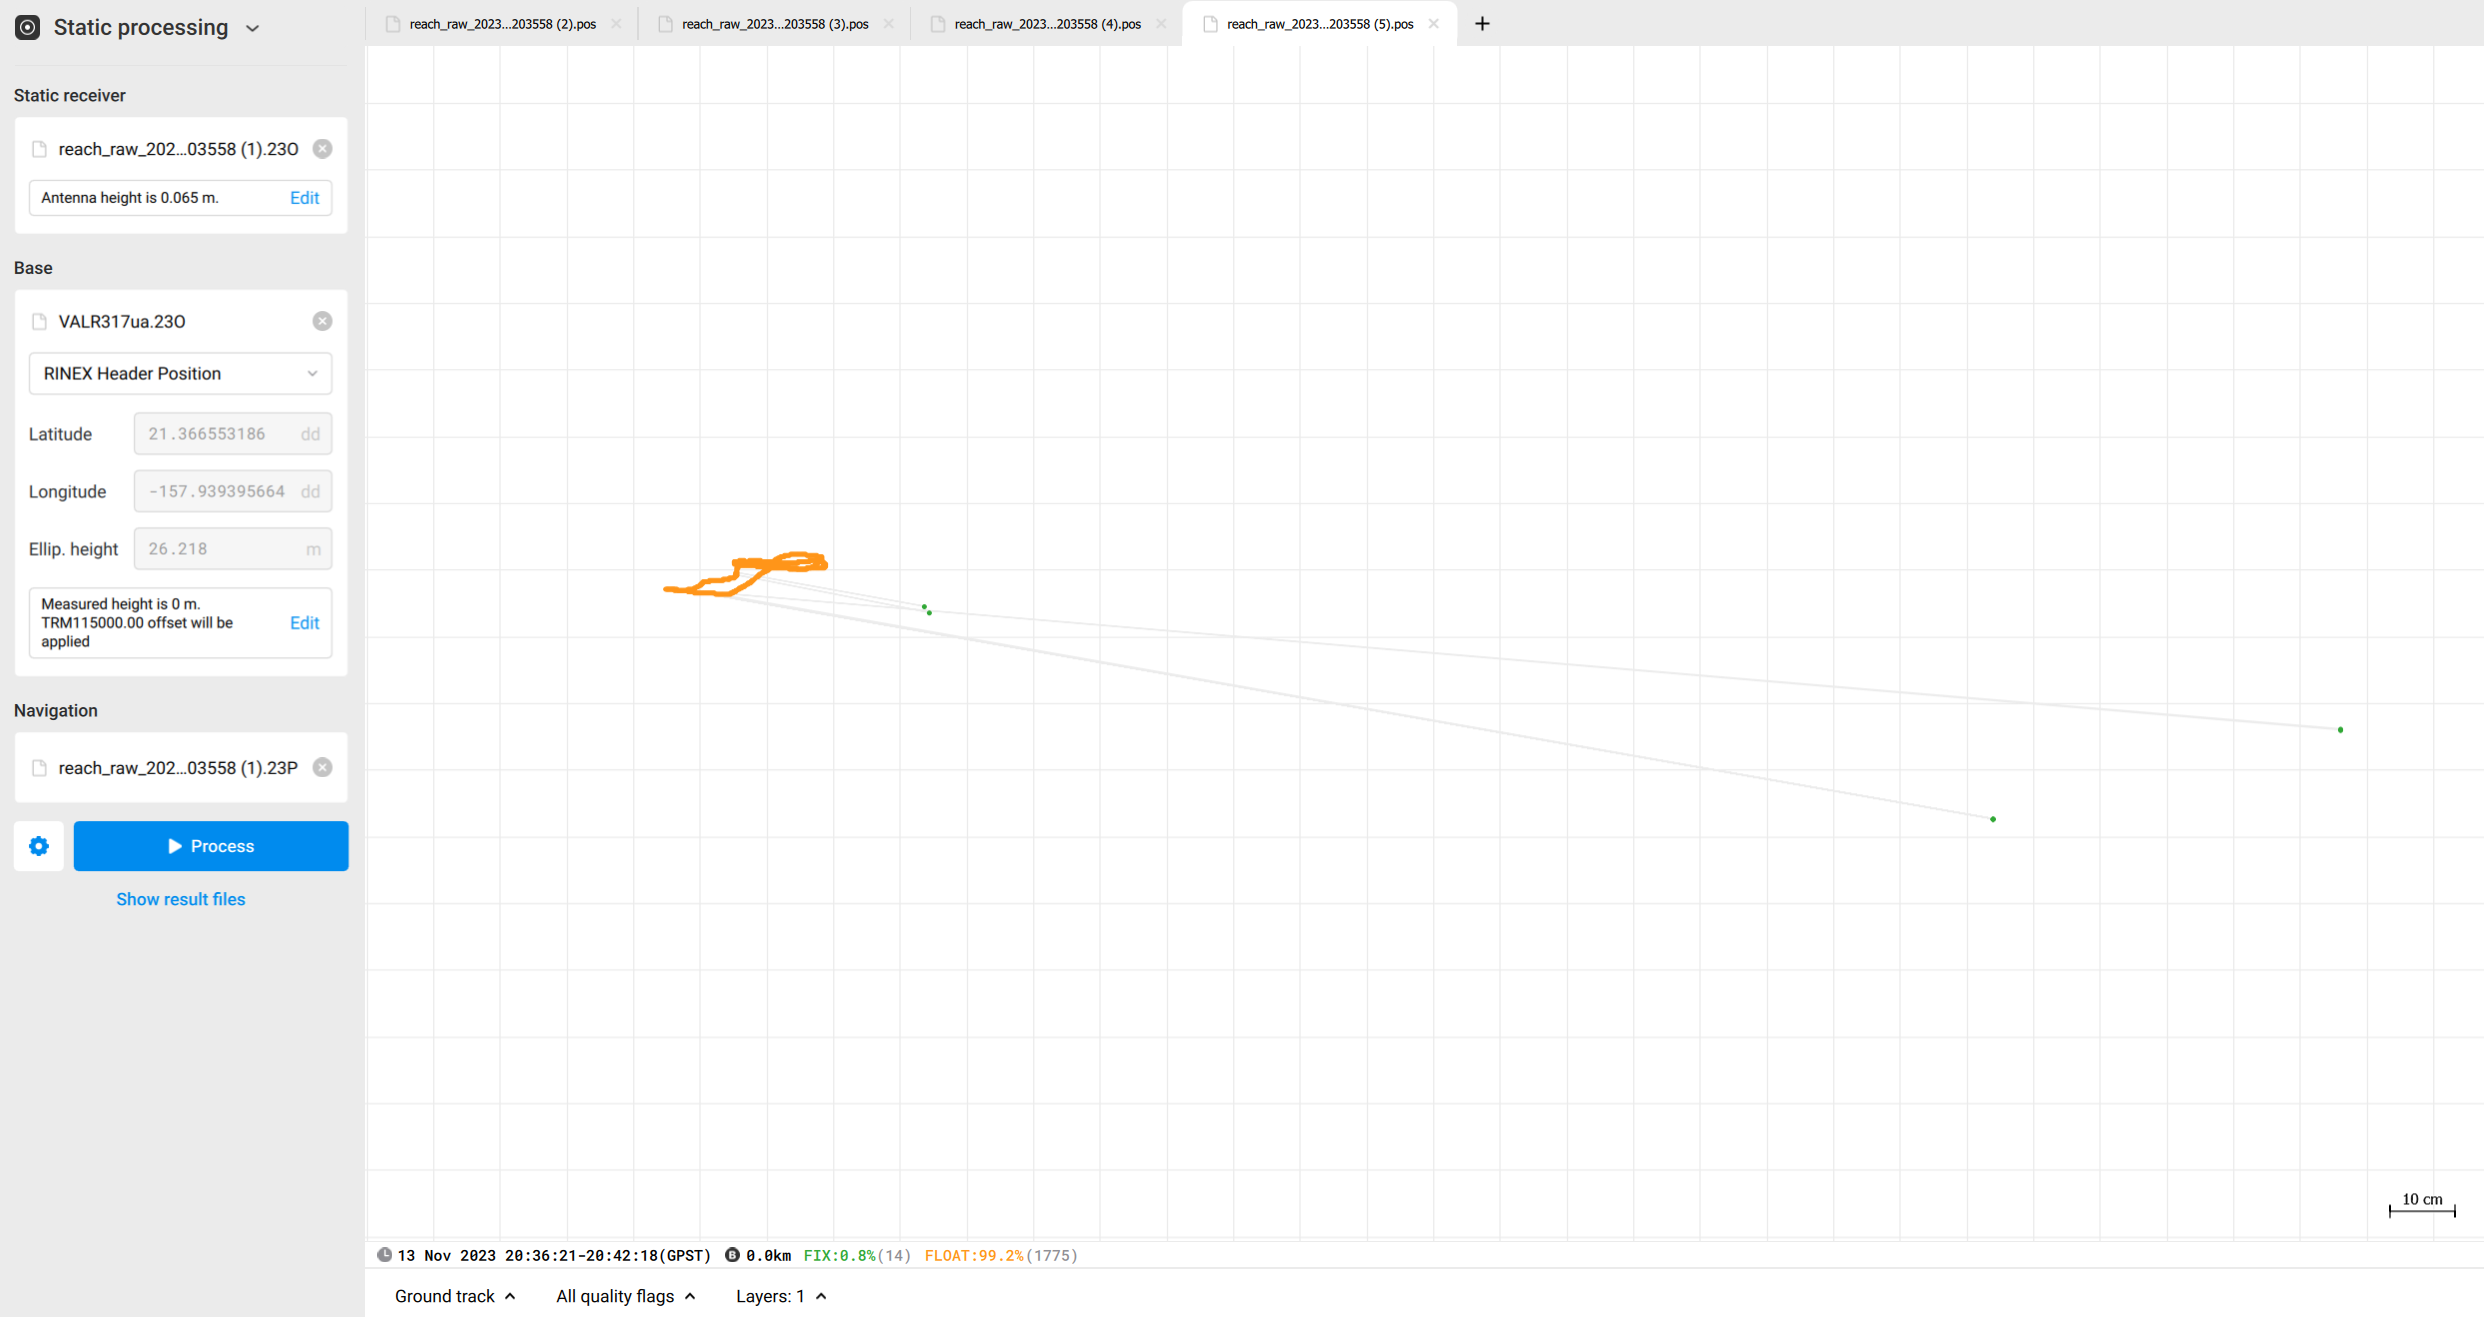
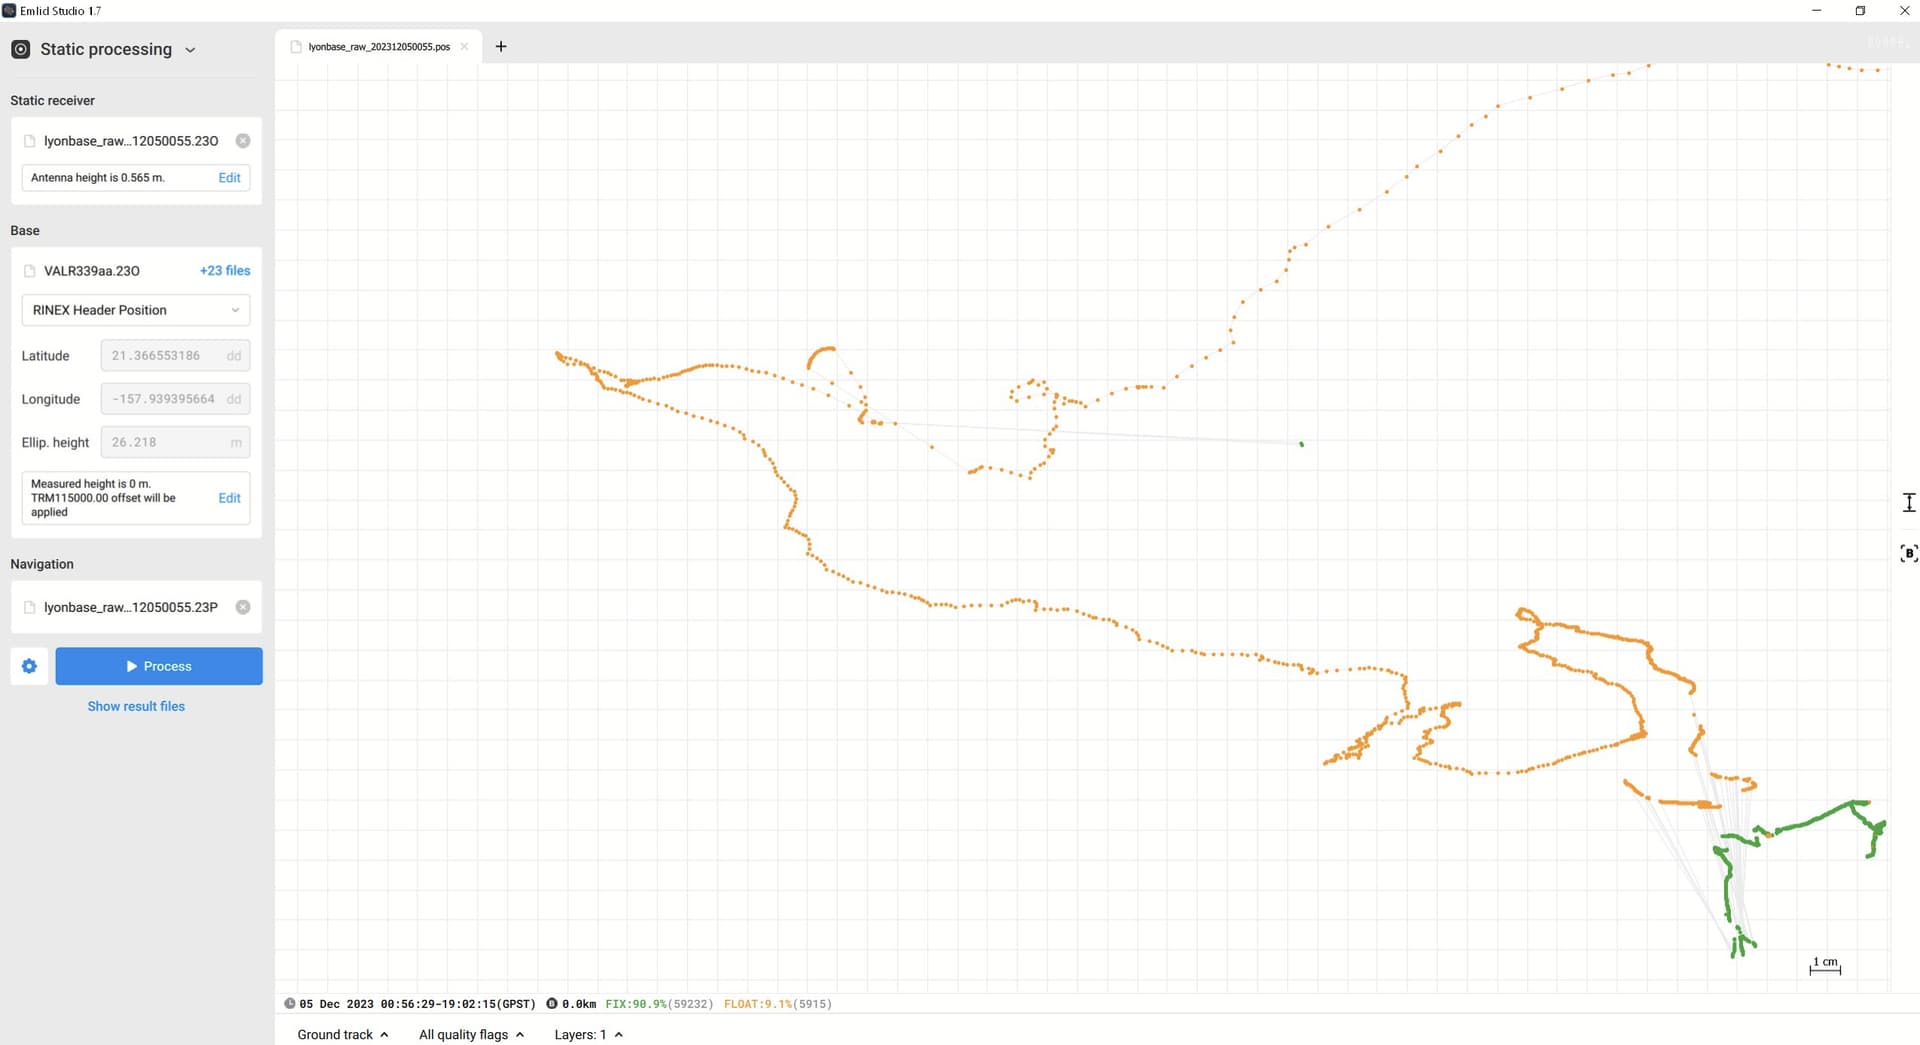
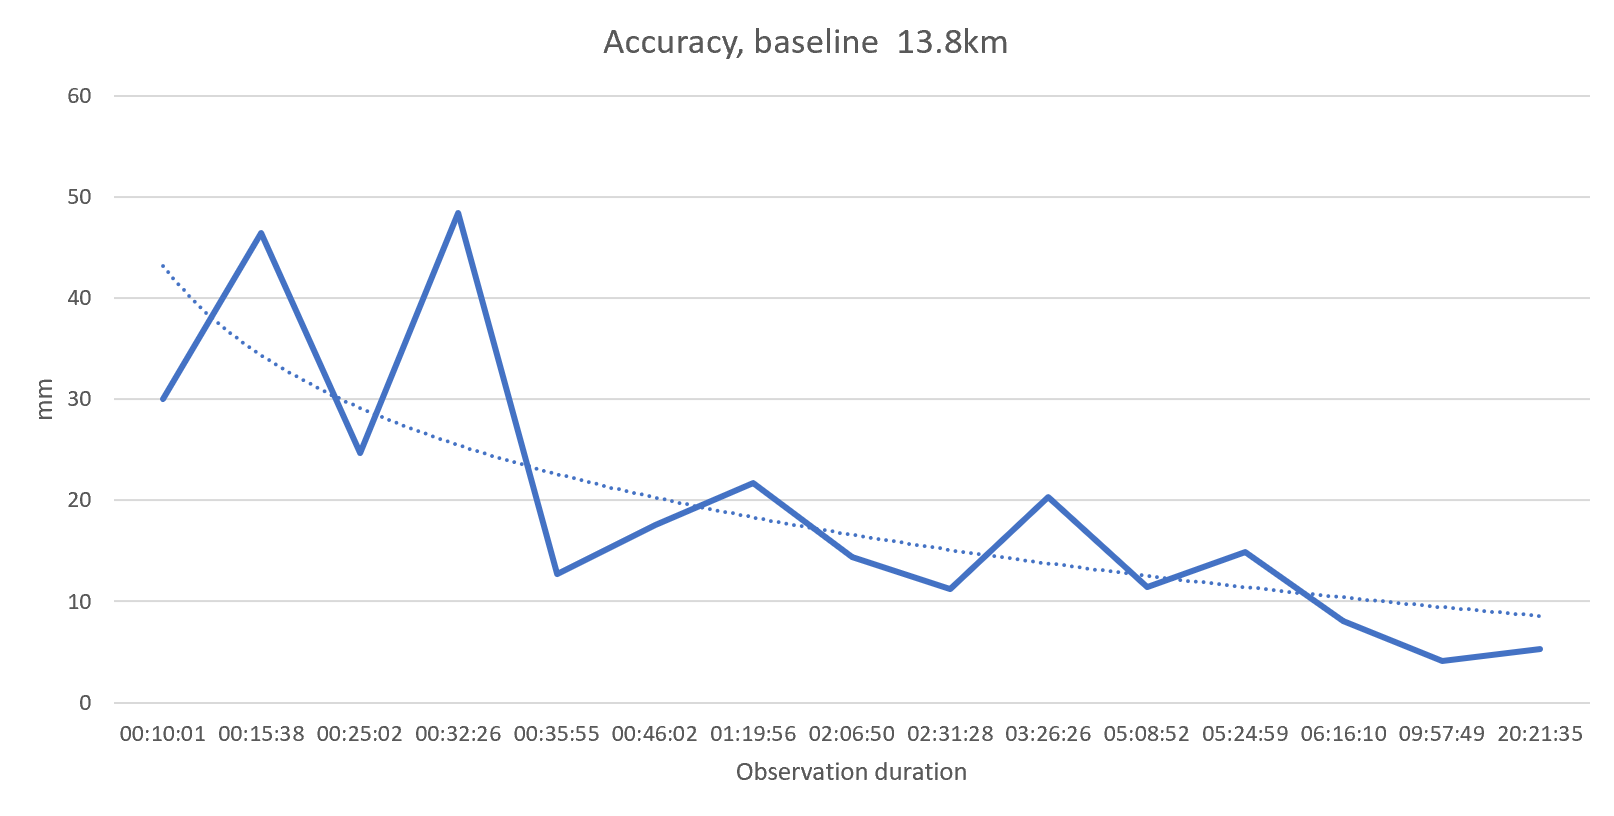
My workflow doesn’t involve creating projects at all, I’ve found it’s a lot easier to just turn on logging for each point and then turn it off. Usually I let it collect data for 5 to 15 minutes, or longer if I have time. So I do static processing. I view both the “multiple solution” and “single solution”. It would be great if this type of workflow was more functional so I have some specific requests that I think would open up this kind of data collection to more people. The first is low hanging fruit:

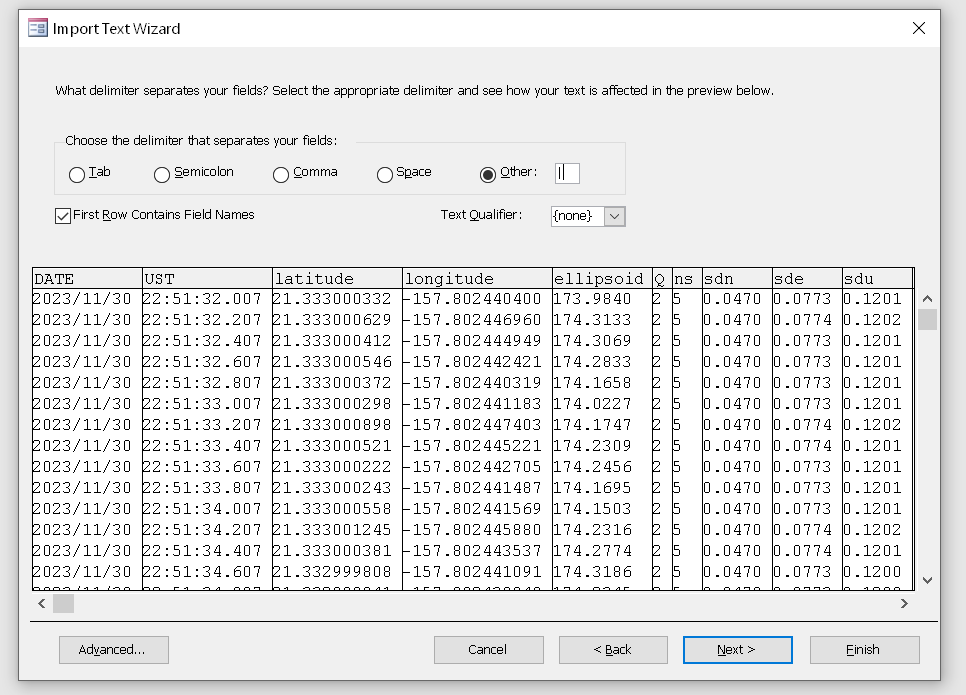
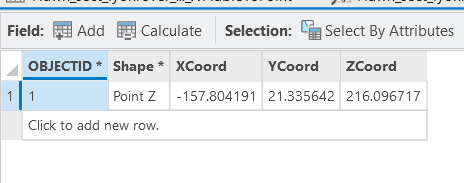
  1. Allow exporting the multiple solution and single solution as a shapefile. Currently I have to copy and paste the coordinates from Emlid Studio, or carefully convert the results file to CSV to import to ArcGIS Pro.

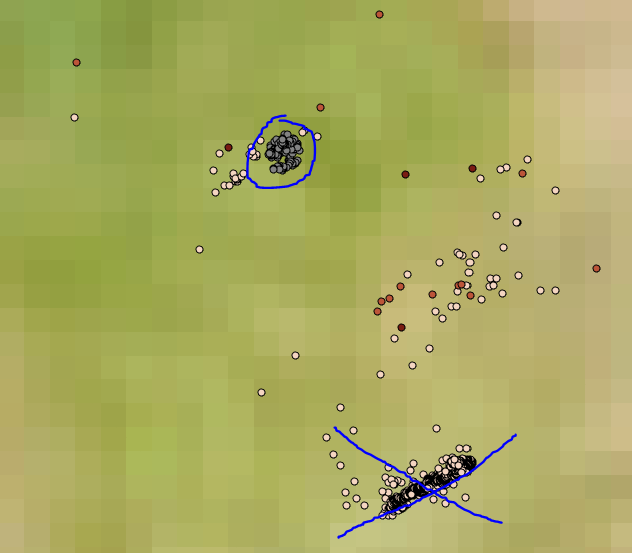
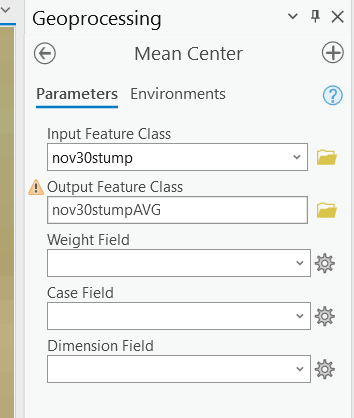
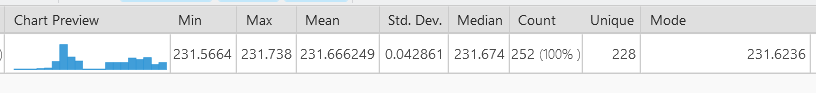
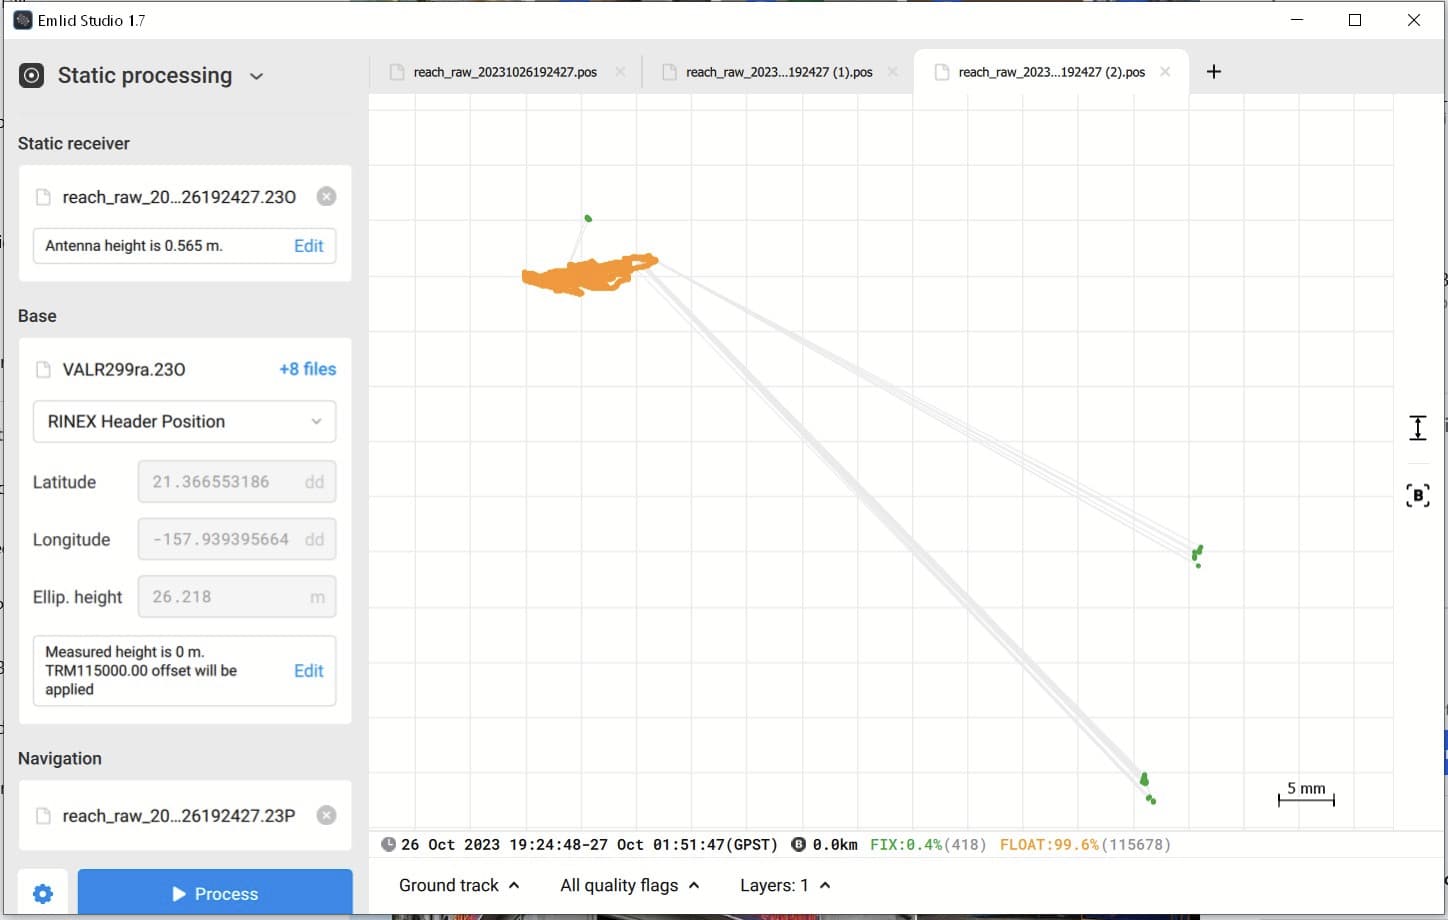
  2. Allow solution points to be removed in Emlid Studio. Often I get a sequence of orange points showing “float” solution, and a few far flung outliers that the software considers “fix”. These fix points seem to get used when you do a single solution. So have to convert the multiple solutions to CSV and then do your averaging in GIS software. If the outliers could be deleted or excluded, that would make it much easier.

  3. Let us select a set of points in the map view and use those to create a point. A timeline view would also be very helpful. That would enable just walking with the device and selecting the points where you’ve stopped, then using the timeline to narrow it down further to when you know for sure the Reach was stationary. Then the resulting set of points could be exported to a shapefile.

  4. This is kind of an alternative to 3. Allow selecting a set of points and exporting just those to a shapefile. That would let you create a shapefile for each set of points you want to average, then do the averaging in GIS software.

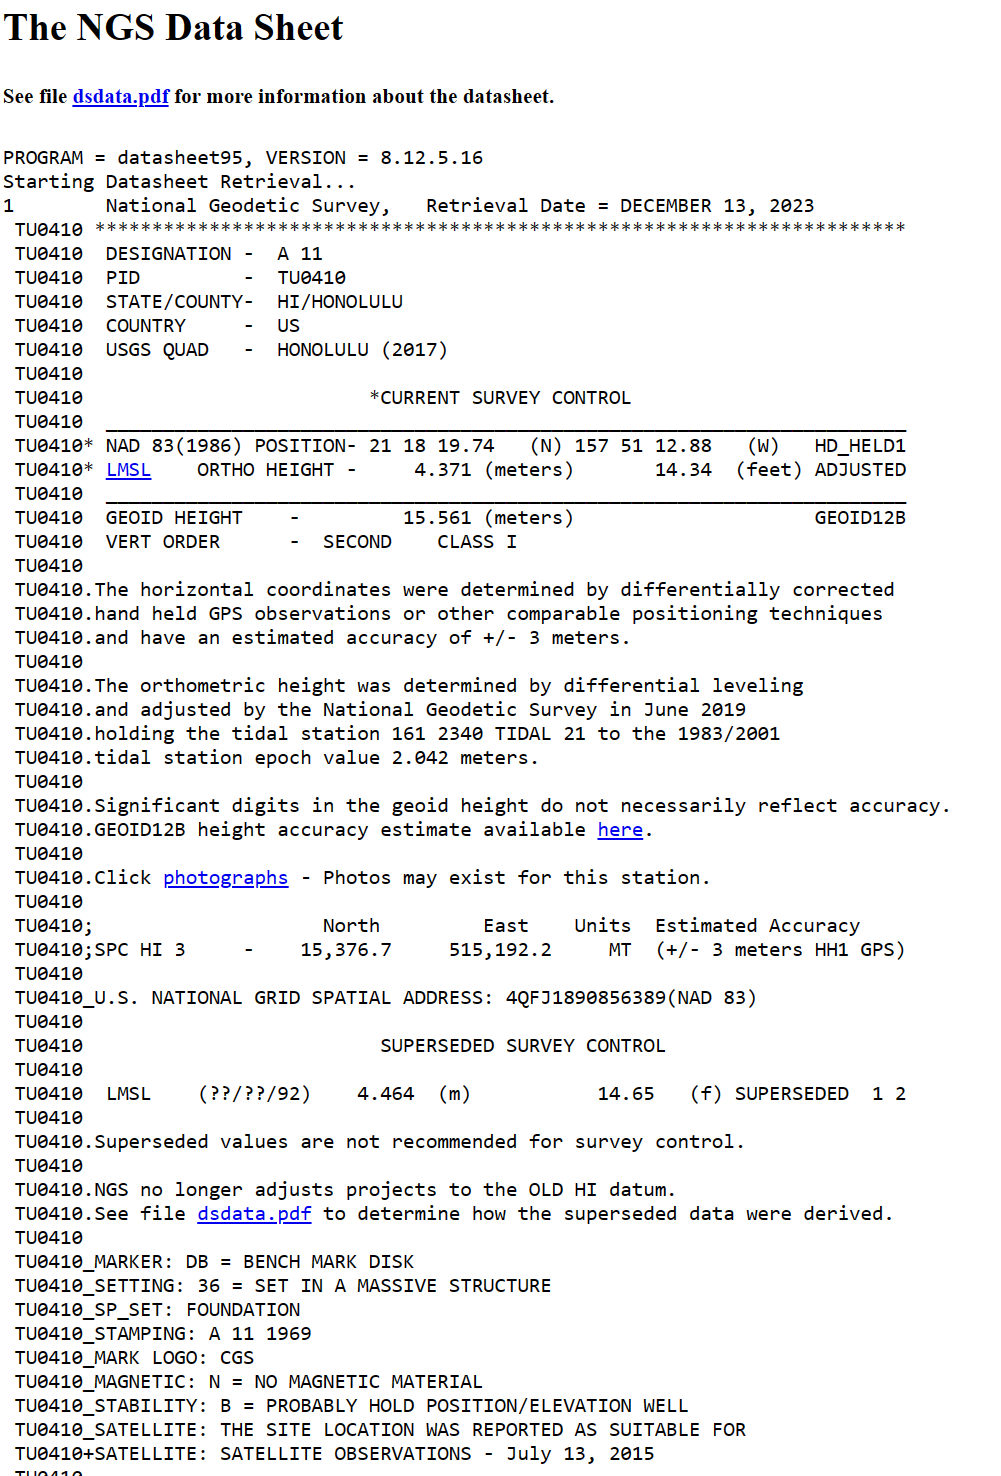
  5. Allow choosing different height datums for your results. In Hawai’i, Mean Sea Level is the most useful geoide. Ellipsoid isn’t very useful because we’re about 16 feet above the ellipsoid but of course it varies by location. Most analysis here involves MSL, particularly due to sea level rise concerns. The standard for LiDAR and photogrammetry here is MSL. Having to convert every height individually takes a lot of labor!

  6. Allow choosing different coordinate systems for your results. This one is less important to me because I use WGS84. But for many users, I’m sure they would prefer a local coordinate system.

I think my suggestions would make an alternative PPK workflow possible for a lot of people, even if they haven’t even considered this. I’ve learned from the Facebook group that very few users are doing PPK, and most don’t even know what it is. So I think better PPK would also open up Emlid hardware to more potential customers who have access to a public base station and can average points for longer periods, vs relying on RTK.

1 Like

This is how I convert my corrected tracklog to a GIS format. First I have to open the POS file, then remove all the text at the top, then carefully replace the random spaces with a delimiter. I use |. And then import that into Access carefully again. Once it’s in Access it can be exported to CSV and then to ESRI software

Then I select clusters of points that look accurate. Usually you can see when there’s a good fix during like 15 minutes of collecting, because you get a circular cluster with a high concentration of points. Best if the Q value is 1

Then I do Mean Center. If the point data set has X, Y, and Z values it will calculate the average of all including height!
image
image

Sorry - I just couldn’t ignore your “look accurate” workflow. I gotta thank you, however, because you’ve given me a textbook example to share with my students: How not to confuse methodological consistency for positional accuracy.

I encourage you to test your method against one, ideally more, known points (NGS Map, 2023).

Also, I encourage you to examine your point clouds in 3D. An apparent cluster in plan view can easily hide a long sequence of multi-path errors along the Z axis. The average of those two fixes you tossed out might give you a more accurate 3-D position estimate than the average of all those floats that seem horizontally clustered.

4 Likes

Here’s the thing, there is no better methodology I can think of than finding a cluster that looks accurate.

If you rely on the software to find a single solution, it will often choose outliers that it thinks have a “fix”. That’s why it’s important to understand the actual data and how GPS works.

You can do statistical analysis but essentially what you should be doing is approximating finding a cluster. The average of two outliers might be more accurate, but they are inherently not accurate to begin with, a location can’t be two distant points.

These are the elevation stats for the cluster I selected

Just being able to export the OBS file to a shapefile or even CSV would be a big help! I tried RTK Lib and can’t find any way to do it. It takes so much time to convert the file using MS Access because of the inconsistent delimiters.

Please add the ability to export a SHP

Sorry, I meant the .POS file with the resulting solutions. I can’t find any easy way to convert it to Shapefile or even CSV!

+1 for the good advice MapScience has given you about testing against known reference marks. Doing so will enable you to better understand what you are actually dealing with and provide a good start point to improve on your methods and results.

If you don’t you may as well simply draw something that looks good and save yourself going out and spending time in the field and buying expensive equipment.

Likewise using WGS84 for your data as stated a couple posts back, the ellipsoid is not a plate fixed datum so will grow in error over time and the coordinates you capture will be somewhere else on the ground and defeats the purpose of precise positioning.

We are in agreement that understanding the data is important. Clicking a button to get a single best solution is the opposite, regardless of whether you compare it to a known point. There aren’t known points, Hawai’i is moving fairly rapidly to the Northwest about 100cm per year, and I haven’t found any source for up to date offsets.

But this is off topic, I’m just showing a method I’m using to get the best location I can in difficult conditions. Letting the software choose isn’t better, and from what I’ve seen it’s far worse. Several points scattered by tens of meters is definitely worse than a cluster, and the software considers it “fix” in Emlid-specific terminology.

I do recognize that surveyors have a mindset of going by specs and trusting the systems they deal with, so they’re more likely to click the button and accept the “best solution”, but GPS is more of an arcane art.

I really just need the ability to create a shapefile. A GPX file would be nice too. RTKPost creates GPX files that are unusable because of errors.

You can do any kind of statistical analysis you want, but you need a format that other software can understand. And having metadata about the satellites, PDOP, etc would help too. ArcGIS Pro has clustering tools that will find clusters using an algorithm!

Sorry, grossly wrong on most fronts here and it needs to be called out as the incorrect statements are misleading to others in some cases offensive.

Hawaii is NOT moving at 100cm a year, and there are plenty of places you can get the data if you want it. Start with your own NOAA. The Pacific Plate is actually moving around 7 to 11cm a year, depending where you are on it, and for that reason you should simply be using a plate fixed datum that doesn’t change. That’s why they are established and maintained at great cost and everybody else uses them.

And there ARE known points all around you, in fact many hundreds of known points across Hawaii. MapScience even provided you a link above, did you bother to read it? Here is a sample from your area of Honolulu, and every one of these has an extensive data sheet like this that is constantly maintained:

And Surveyors don’t simply click in software & believe the result, to state that is very ignorant and offensive to them. Surveyors have an obligation of legal traceability, and they are technically highly skilled in establishing and confirming, double & triple checking known points via rigorous processes and standards that will stand up in court if needed. I work with them at times calibrating survey marks and CORS antennas. My work life started in technical military communications, and I have many years’ experience precise mapping at the cm and mm level with GNSS. On what grounds have you concluded “GPS is more of an arcane art”?

A shape file could have benefits, but only if you maintain discipline with time dependent transformations to plate fixed datums. Like the hundreds of known points around you in Honolulu. If you keep your data in WGS84 you are wasting your energy and your errors are growing at the same rate that your plate is moving away from underneath it. And a GPX file is inherently WGS84 so also back to square one. And by the way the .gpx files I have opened out of RTKPost have worked fine.

If you really want a shape file then use a proper tool like Global Mapper. You can quickly load a .pos file, reproject it, and export a .shp in a few mouse clicks.

The notion of positioning via clusters is nonsense, leave those GIS tools for the data analysis they are designed to do and are good at and not for positioning. If you want to fuss over positioning then same message, get the right tool for the job such as surveying software, for example like Trimble Business Center, and learn about things like network adjustments and loop closures etc.

Otherwise suggest first spending some time developing a basic understanding before committing to processes and tools or making profound incorrect statements.

3 Likes

Sorry, I was off by an order of magnitude. I was thinking of how I explain it to folks, that in a decade we’ve moved 100cm which is enough to worry about.

The example point you posted is GPSed to 3m accuracy and the units are to 0.1 meters precision. This is the one closest to where I work, also 3m: https://www.ngs.noaa.gov/cgi-bin/ds_mark.prl?PidBox=TU0469

If you can tell me how to figure out the coordinate of that benchmark now in 2023, I will collect an hour of coordinates and test my method.

I used UTM NAD83 PA11 coordinate system and datum at first, but discovered that Emlid Studio doesn’t convert the coordinates properly. So I would have to use WGS84 and then convert anyway using GIS software. I chose to switch to WGS84 to match pretty much everything else here, including the state and federal data on ArcGIS Online.

The GPS units themselves function in WGS84 geographic, IE they’re calculating position in space regardless of the positions of features on the ground or previously calculated positions. Corrections are based on the position of the base. So if you convert to a coordinate system to get your positions to match existing features, and then use those positions for the base station, you’re introducing error. The errors may even out in the end.

What do I mean by GPS being an arcane art? Look at the points below. These were collected overnight and corrected using the Pearl Harbor VALR base station logs. The green points are all positions that Emlid Studio classifies as fix, and are in the native coordinate system of the receiver and the software, WGS84 geographic. Which of the points is “accurate”? Is the average of all of them the most accurate possible? That doesn’t coincide with any of the actual solutions, it’s in the blank space in the middle of the V shape.

Here are solutions for a fixed location. Which is more accurate, the cluster of non-fix points, or the 3 spread out clusters of points where Emlid Studio believes there was a fix?

The round icons are predominantly vertical marks with average horizontal accuracy. I just clicked on the first thing that popped up as example and it happened to be a vertical mark.

The ones you want are the horizontal mark triangles. Some are combined in circles because they are both. The most accurate are the first order ones and the best near you would be Tantalus lookout: https://www.ngs.noaa.gov/cgi-bin/ds_mark.prl?PidBox=TU1212

The NAD83 UTM coordinates are in the data sheet, they are permanent and in the case of first order should never change other than possible minor precision refinements over time in the order of mm.

If you don’t have any normal tools to convert to/from NAD83 Lat Lon then use this online tool: NGS Coordinate Conversion and Transformation Tool (NCAT)
In case you miss it your UTM zone is 04 North and you can enjoy the view while you keep an eye out no one steals your gear.

Your correction plots have no meaning without a lot more information on what you did, how you did it, where, how the equipment & software was configured, the environment etc. And this is why you should start checking over known marks as a baseline to help get it figured out and set up right.

An example only to illustrate, here’s a plot of some testing I did to get a feel for processing Trimble geodetic data over longer baselines through Emlid Studio (without capability of precise orbit & ionosphere/troposphere). The plot is of various length observations over my reference point and shows its taking around an hour to achieve 2cm and become consistent, and longer to converge down to a few mm. Anything less than an hour and the results are erratic. Your case is different, it’s the concept and bigger picture I’m trying get across but also because your earlier mentioned you are only doing 5 and 15 minute observations.

There is one question that does stand out, you state you are using WGS84 yet also state you are post processing against a local CORS base. Most CORS bases provide coordinates in the national fixed plate datum, not WGS84. We do it in Australia and so does the US NGS: FAQs about NCN - National Geodetic Survey Extract: “It is the policy of NGS to overwrite the approximate position in the header with the published NAD83 position, but some older files may not have these corrections”. If that’s the case with your base your resulting differential coordinates would also then be NAD83 - which is the reason it’s done - to avoid all the errors with WGS84.

If your resulting coordinates really are in WGS84, and you are unable to transform in ESRI, the NOAA provides an online tool for time-dependent transformations here: https://geodesy.noaa.gov/cgi-bin/HTDP/htdp.prl?f1=4&f2=1

And if you are maintaining your data in WGS84 to be consistent with ArcGIS Online for government data then you are firstly wrong, because you don’t have to, and secondly you are then actually in an even worse situation.

ArcGIS (and Google et al) default to the Web Mercator projection which is NOT accurately consistent with WGS84. The projection is simplified from an ellipsoid to a sphere to speed up calculations for web serving and user browser performance and so does not match the WGS84 ellipsoid and introduces error and distorts data. And this is on top of all the basic time dependent issues of WGS84 itself.

Think of Web Mercator as the Tik Tok of the mapping world. Many organizations and government departments won’t allow it for formal data purposes. If you want to work in this space then I don’t understand why you are even bothering to try and accurately post-process your data in the first place.

I believe it is possible to tell ArcGIS to transact in the projection you specify, and presumably then access the government data in its robust original projection rather than mincing it through the Web Mercator Tik Tok joke box, but you will have to figure that part out yourself.

1 Like

I’ll post more on this tomorrow but basically WGS84 seems to make sense right now because it’s what the systems I’m dealing with work in. The drone GPS generates WGS84 coordinates, Agisoft Metashape understands WGS84 but has trouble with UTM NAD83 PA11 coordinates, and the Emlid RS+ works in WGS84 natively. I’d rather have WGS84 data with known dates that I can then convert to whatever I want later.

I know Web Mercator isn’t the same but ArcGIS Pro handles the reprojection before uploading to ArcGIS Online. Web Mercator WGS84 is necessary because that’s the only way you can do tiled data. Otherwise you’re stuck with vector data.

You can reproject any data to a different coordinate system and datum with ESRI ArcGIS Pro. But I can’t find any way to take into account the “epoch” of the data to adjust for tectonic movement.

And here is the header for the VALR station in Pearl Harbor. I assume that the position is up to date and that Emlid Studio adjusts it to WGS84 GCS since that’s the coordinate system and datum the GPS works in…

     2.11           OBSERVATION DATA    M (MIXED)           RINEX VERSION / TYPE
NetR9 5.56          Receiver Operator   20231211 150000 UTC PGM / RUN BY / DATE
VALR_BASE                                                   MARKER NAME
VALR                                                        MARKER NUMBER
VALR_GNSS_BASE      NATIONAL PARK SERVICE                   OBSERVER / AGENCY   
5306K50813          TRIMBLE NETR9       5.56                REC # / TYPE / VERS
61063G0008          TRM115000.00    NONE                    ANT # / TYPE
 -5507362.1664 -2231897.9556  2309246.7363                  APPROX POSITION XYZ
        0.0000        0.0000        0.0000                  ANTENNA: DELTA H/E/N
     1     1                                                WAVELENGTH FACT L1/2
    17    C1    L1    S1    P1    C2    L2    S2    P2    C5# / TYPES OF OBSERV
          L5    S5    C7    L7    S7    C8    L8    S8      # / TYPES OF OBSERV
     5.000                                                  INTERVAL
  2023    12    11    15     0    0.0000000     GPS         TIME OF FIRST OBS
L2C CARRIER PHASE MEASUREMENTS: PHASE SHIFTS REMOVED        COMMENT             
L2C PHASE MATCHES L2 P PHASE                                COMMENT             
GLONASS C/A & P PHASE MATCH: PHASE SHIFTS REMOVED           COMMENT             
                                                            END OF HEADER       
 23 12 11 15  0  0.0000000  0 23R 1R23G 2G27G31R 2G 8G 9G28G17G 3G 4 0.000000000
                                G21R 3R17R24E36E 8E30E15E34E 3E 5
  21864372.891 7 116877679.058 7        42.400    21864371.160 7  21864369.051 5
  90904882.502 5        37.100


  22437239.516 7 120024271.117 7        41.300    22437239.375 6

WGS84 is intrinsic to all GNSS devices, they all have it as the native default simply because the satellites orbit around the ellipsoid. That’s just how the system works. It’s generally through RTK and/or post processing that the “right” datum is applied for perpetuity so you won’t end up epoch deprived down the track.

Many image formats support tiling and other projections. It’s sounding a bit like the ESRI sect has you captive or maybe because you are simply leveraging access through your employer.

Your RINEX coordinates are…simply coordinates. They don’t tell you anything, they could be anywhere in any datum. Like most CORS base stations the NETR9 is simply configured by the operator with simple coordinates to send/save (or unlikely, it can also be configured to just use its own autonomous position which would defeat the purpose). It has no idea, it just does what it’s told.

The operator should and would normally include these details in the station metadata. You absolutely need to know this, there’s no point in carefully post processing…the wrong place. I can’t locate any references for this CORS from here so you will have to follow up that yourself to be sure.

However my best guess is that they are more likely NAD83, not just because it would normally be expected, but also because this appears further supported by plugging the ECEF converted ground coordinates into Google Earth, e.g. therefore being treated as adulterated WGS84 (and assuming the satellite image rectification is somewhat close to accurate), and the point appears teetering precariously on the southern edge of the roof. E.g. it’s possible the building, taking its antenna and coordinates with it, has drifted north since the datums were initially in alignment in epochs gone by. And since 1983, at 10cm per year that would equate to about 4m which looks about right.

And if you continue to maintain your data in WGS84 this is the illustration of the exact problem you are going to face.

But I could be wrong, I was once.

Unfortunately there is very little metadata. I’ve tried contacting NPS but haven’t gotten anywhere. But I can try contacting the professor involved in setting this stuff up, Jeff Freymueller.

Where in the header do you see a coordinate? I looked at it a while back and never saw anything that looked like lat and long so I figured it must be encoded and readable by software like EMLID Studio. Trimble GPS Pathfinder office finds this station through CORS and also finds the coordinates somehow. Does everybody who uses such a station have to manually adjust the coordinates for a given year or week to account for tectonics?

The coordinates in the RINEX are in ECEF. I did the transformation to LL using the NGS NCAT site I posted earlier, the option to select is labeled XYZ. Note in the Rinex file it’s labeled “APPROX POSITION” but in practice CORS operators will normally populate this with precise surveyed coordinates in the local plate fixed datum.
The devices and software will automatically transform LL to and from ECEF for you.

OK, now you are starting to get it. And maybe see why you now have even more issues digging yourself deeper. The simple answer is they don’t, and why they don’t use WGS84.

NAD83
If this rogue station coordinates are in NAD83, you still have no idea how accurate, or even if they were formally surveyed at all. Maybe it’s even another datum altogether.

As an example for this situation in Australia, we calibrate CORS every 5 years to our national fixed plate datum GDA2020. Our national science authority issues certificates confirming coordinates to 95% uncertainty and the current certificates are made available for each site. Example here:
https://cors1.vicpos.com.au/REG13/PKVL.pdf

I don’t know what the regulatory situation is in the US, other than the NGS data sheets confirm you are still using the legacy first/second/third order classifications. But this site is clearly something else again and a black hole at least to you (maybe internally within NPS it’s more structured).

US CORS coordinates are normally NAD83, done at least once and fixed to the plate. The idea is set and forget. Then all of you there that are surfing that plate can go and play golf. And whenever you tee off, the distance and coordinates of the hole remain exactly the same so you become good with consistent holes in one. Life is good.

WGS84
Now suppose for some odd reason the coordinates of this station are actually WGS84.
Again you have no idea if it was ever formally surveyed, or to what standard. But now it’s much worse because of the drift. And it has to be surveyed because the standards won’t let you “guess” the amount.
In Australia we would ask “how much can a Koala Bear?” And an indicative answer might probably go something like this:
Geodetic GNSS is capable of positioning to a few mm, and many survey standards call for accuracy less than1 cm. So if you are surfing along at 10cm/year that is 8.3mm monthly drift + 3mm device accuracy = 11.3mm. So you would already be exceeding the standard and would have to resurvey the CORS at less than 1-month intervals. It’s just not practical and not going to happen, and certainly not in this station example.
And if you think this is over the top here’s a California Department of Transport survey accuracy standards document that includes a 5mm standard for CORS base stations: https://dot.ca.gov/-/media/dot-media/programs/right-of-way/documents/ls-manual/05-surveys-a11y.pdf

And back to the golf analogy, now every time you rock up to the course the hole and flag - which aren’t fixed to your big surfboard - have moved. You have no idea how far so you have to recalculate it’s coordinates every time. But constantly having to remember and do the calculations you start making mistakes and introducing errors. And even if you get it right, because the distance has now changed you are losing consistency and lucky to even hit the green. Life has now become a big pain.

I’m stuck on the issue of not knowing the position of the base station.

If we don’t know the absolute location in space, the corrections being calculated aren’t accurate. The software would “think” that the satellite signals are being delayed dramatically or being sped up beyond the speed of light.

I guess the end result is that the positions are roughly offset. I accidentally forgot to set the location of my base station a few times and got an offset tracklog coordinates by several meters, so it is close enough to being a linear offset. But technically you can’t just assume a shift because that’s not how differential correction works.

If the elusive operator has gone to ground you still have options available, the CORS base is still a receiver so just do it yourself.

  1. Process their files through one of the free PPP services. Try it over 2 to 3 days data, anything longer is overkill. If you can’t get a single file and exceed the service input file limit then GFZRNX is a great utility tool that can combine files but it may take a bit of learning, bear with it: https://gnss.gfz-potsdam.de/services/gfzrnx This would be the most accurate as it’s being done directly, on geodetic equipment under what looks like good GNSS environmental conditions.
    or
  2. Post process the CORS base against your own control. Set up a reference site with your RS2 at home or wherever and process a PPP as above. Once you are happy with the result, then post process the CORS site as a rover against your new base. Try and keep the baseline as short as possible, the longer it is the longer you want the observation to be. The test plot I posted earlier will give you an idea. But you will have the penalty of compounding error from multiple processing calculations, the impact of the baseline itself, equipment grade, and potentially environmental.

If everything matches with the exisiting coordinates then fine. If you come up with a better result for the CORS location you have a few options to use your shiny new base coordinates.

1. Set & Forget
RTKLIB can be configured under Options-Positions-Base Station to control what coordinates are used for processing. The options include using the internal RINEX File coordinates, or inputting your own shiny new LL or ECEF coordinates, or a position file.
Or you could manually edit an RTKLIB config file:

Or you could manually edit the startup file RTKPOST.ini to include them (this one shows a random sequential ECEF string I configured in Options):
image

EMLID Studio does not (at least currently or visibly) offer any options for this, however it does maintain a subset of RTKLIB settings in the registry here: Computer\HKEY_CURRENT_USER\SOFTWARE\Emlid\Emlid Studio\post-processing
And these include what appear to be similar options for base positioning, as well as 3 x axis coordinates. Presumably this is for future functionality but could currently be just an interface limitation and at the risk of being chastised by EMLID here you could be the guinea pig to try it out and report back:

2. Manually edit each RINEX file
The old school way is basically edit each & every downloaded RINEX file. First work out the new ECEF coordinates, then with a text editor update the coordinates in the antenna position line in the first RINEX file. Then copy that whole line out and keep it handy in another text file to simply paste in each time you download a new RINEX file.

Whatever you do, from time to time I would check they haven’t moved anything. Easiest is just keep any eye on the downloaded file coordinates that would (should) get updated if they move something, and/or at times repeat the PPP exercise to be safe.