THANKS. I actually did get in touch with the National Park Service supervisor and he connected me with the GIS person, so I’ll see what information I can get from him.
But it didn’t occur to me to try to process the logs myself. I’ll try combining a few days of logs and process them with OPUS!
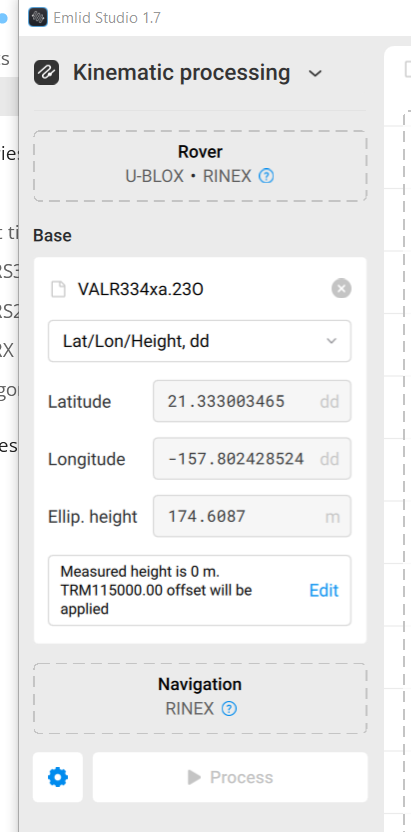
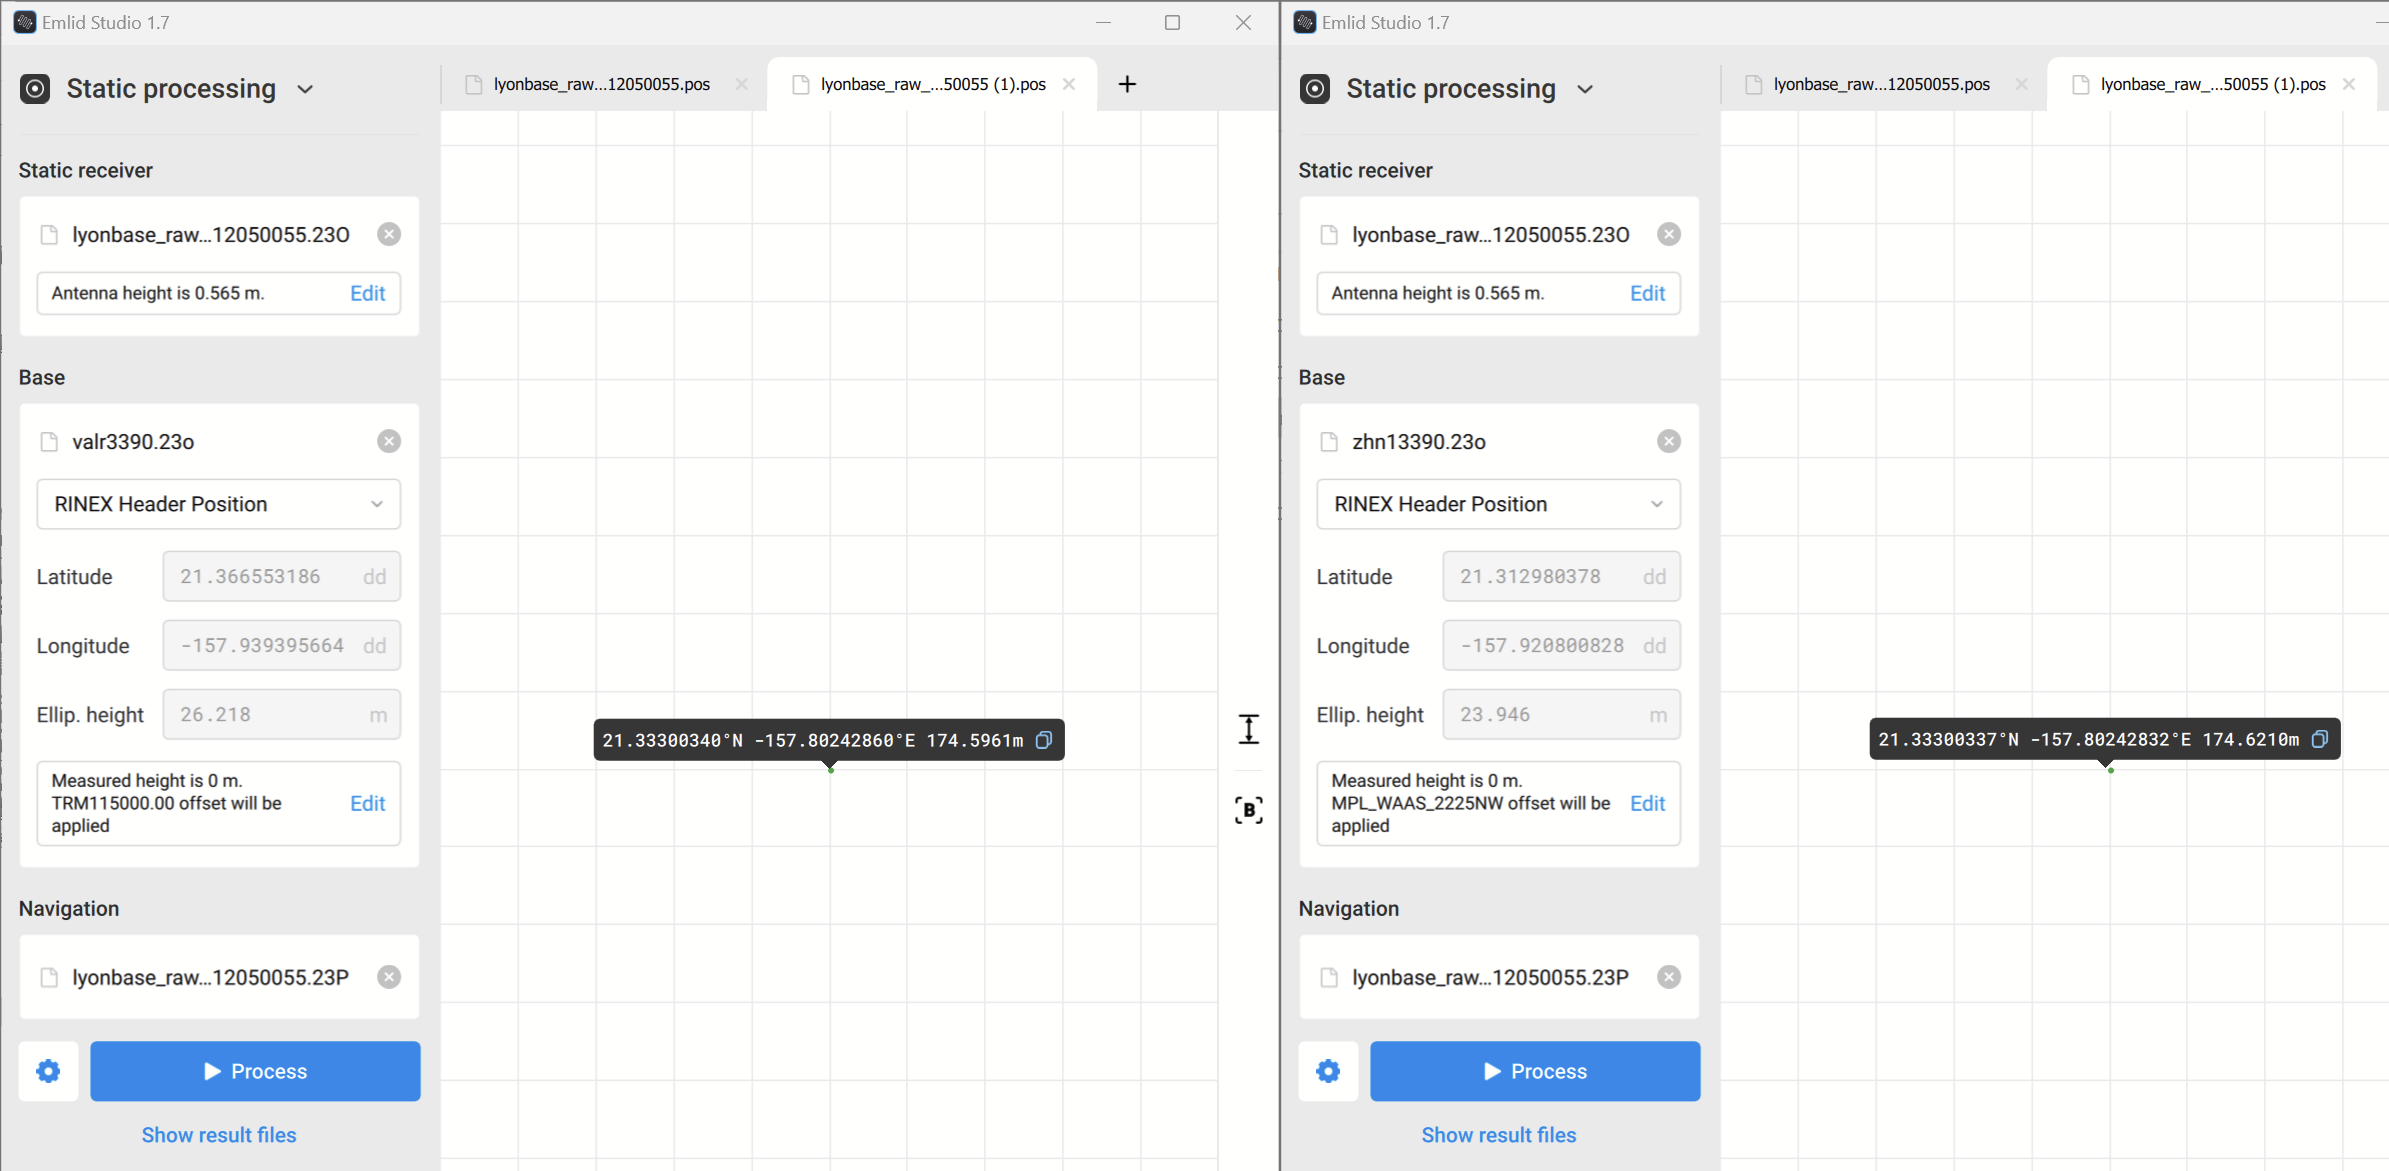
Emlid Studio does let you choose coordinates. I discovered you HAVE to do that with your own base station. I just have one .pos file that I load for my base station coordinates. It seems like a major oversight that the header contains non-corrected averaged coordinates. It doesn’t seem that everyone knows about that because there are several threads on this topic, basically “Why am I getting inconsistent positions?”
When you say Emlid Studio lets you choose coordinates I assume you are referring to what’s happening in Emlid Flow when you are recording your own base with Reach device?
This is a different scenario, the reason I mentioned that it was not currently possible to change the coordinates in Emlid Studio is in the context of using independent RINEX base files from somewhere else. E.g. this case we are talking about the RINEX files from your NPS CORS which contain header coordinates that would otherwise be used by Emlid Studio by default, and that you want to override.
Also FYI I normally use AUSPOS here and just had a quick look at OPUS and noticed it limits you to 48 hours max data.
I’m talking about Emlid Studio. The values are greyed out but you can still drag and drop an OBS file. I just dragged the one from my own base station and it replaced the Pearl Harbor coordinates
This dovetails in with what I call “minimal pos” which is a stripped down quick and easy way to save and open known reference coordinates with Emlid Studio. For example, opening published coordinates of a survey mark as Layer 2 after processing to compare test results.
You can quickly create a minimal pos in a text editor like Notepad, simply start with two leading zeros to represent the expected Date & Time, then followed by your Lat and Lon with anything up to 9 decimal places and Height in meters up to 4 decimal places. All fields separated by a space, and a new line (CR/Enter) at the end, and then save it as .pos. That’s it.
The minimum format looks like this:
0 0 DD.DDDDDDDDD DD.DDDDDDDDD MM.MMMM
CR
I couldn’t get the VALR station logs to process on OPUS, got some error about how it couldn’t verify the source of the log.
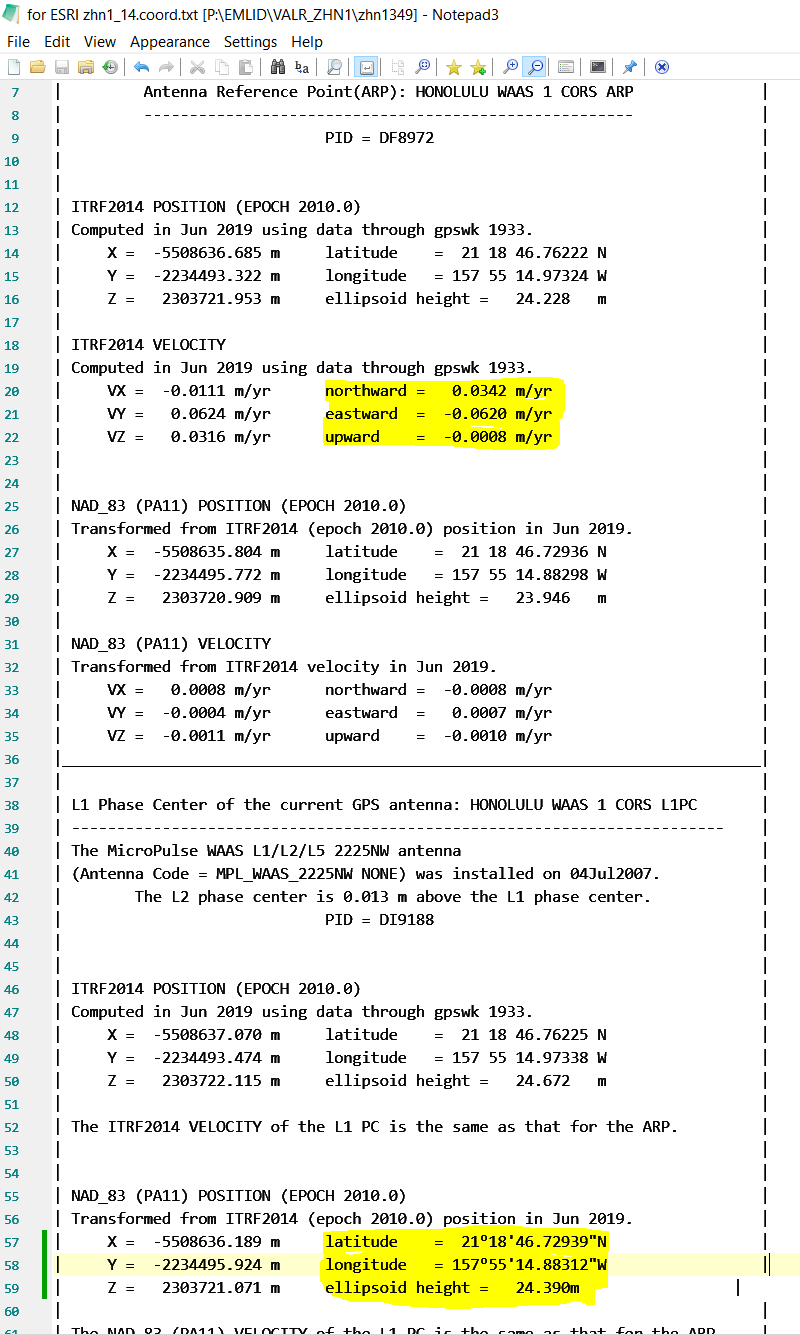
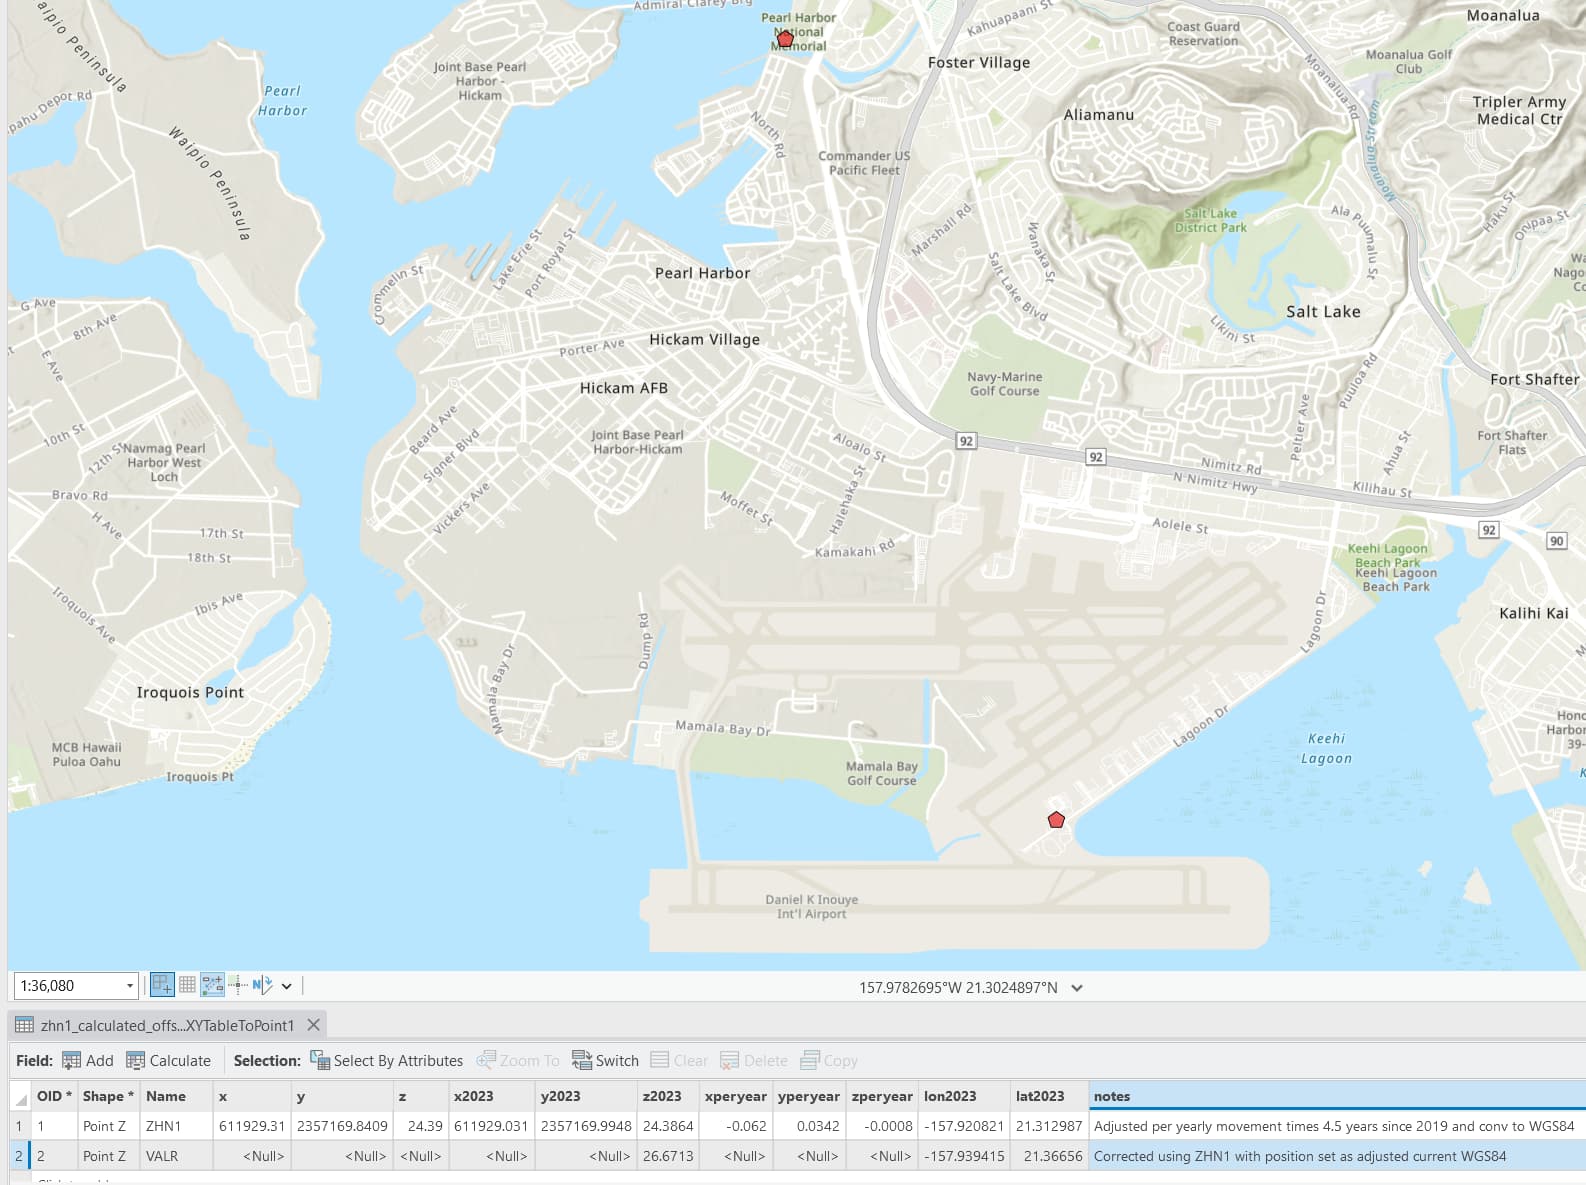
But I was able to correct it using the CORS station ZHN1 for a full day. I guess the sky is the limit, I could average a whole year. But I still need to figure out the absolute location of the ZHN1 station in WGS84.
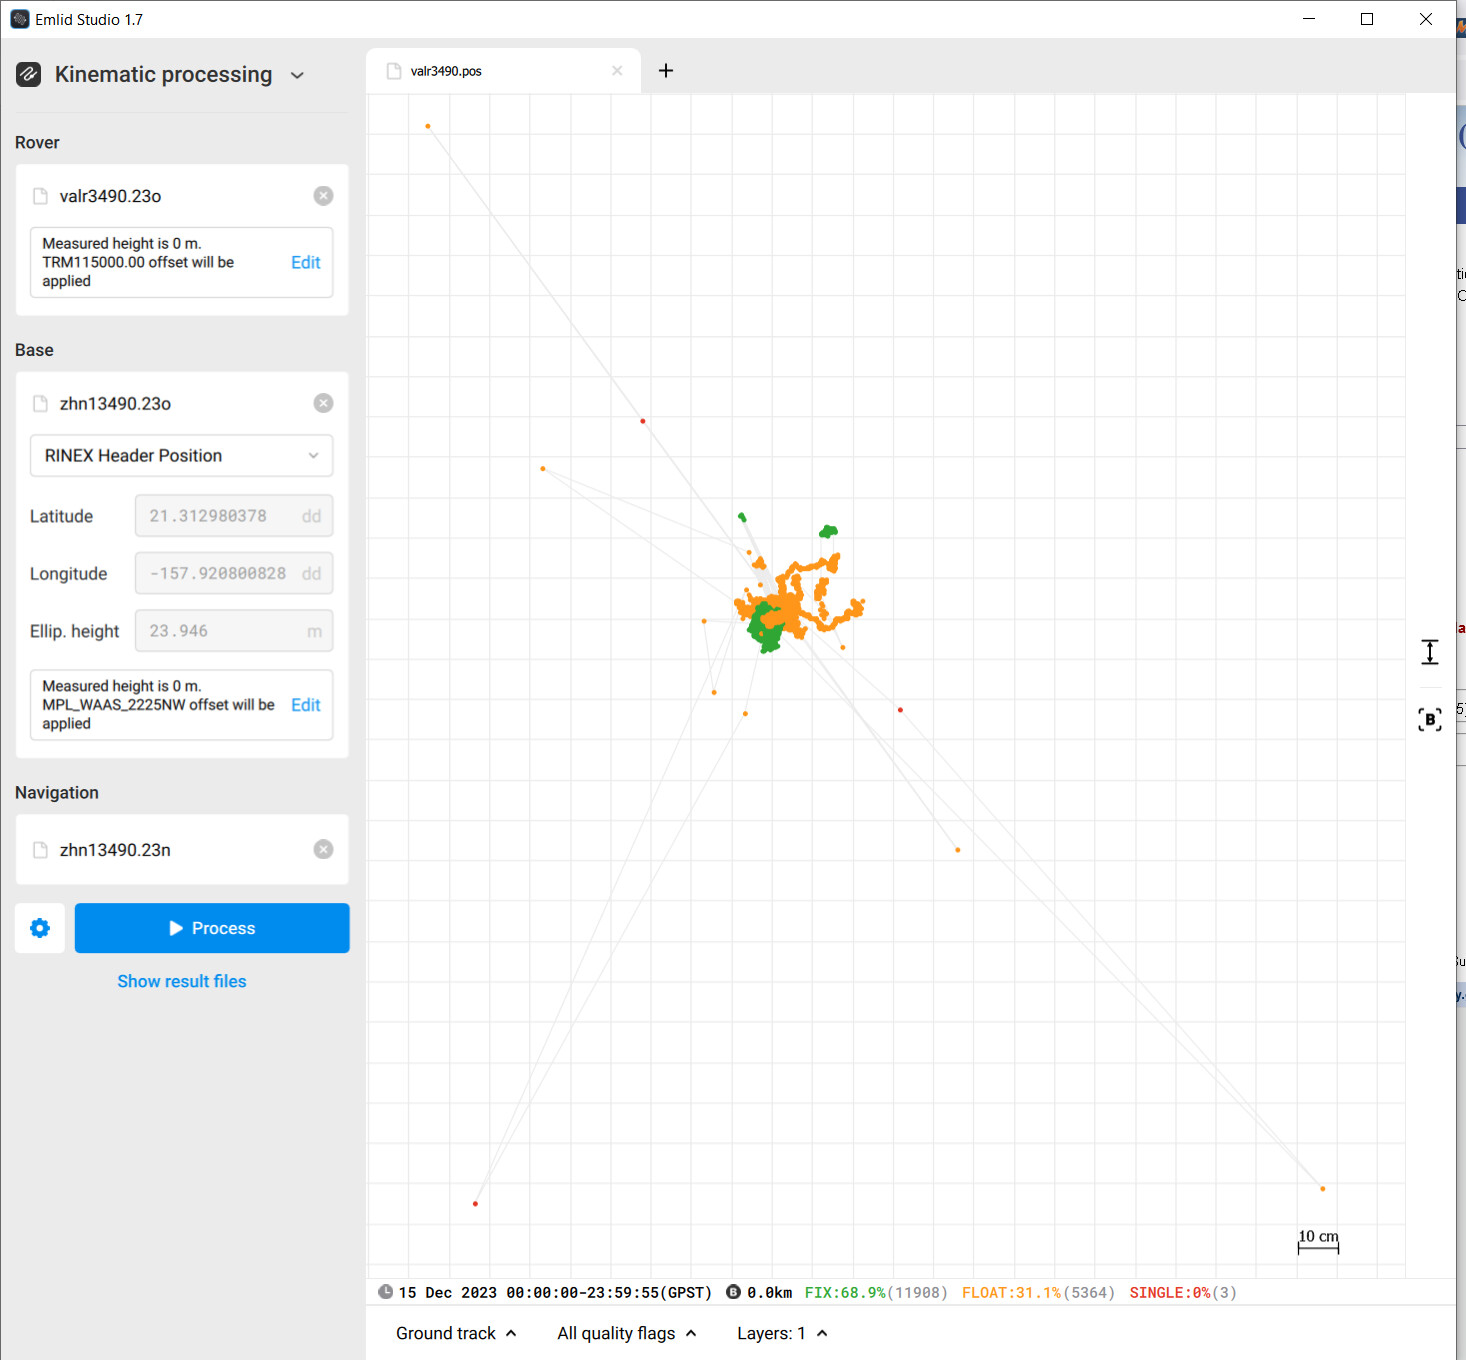
The plots look like you processed Kinematic or All solutions and as a result are pointlessly messy. You aren’t mobile so you are unnecessarily forcing it to jump around leaping from point to point with half arsed attempts at processing each one separately when you don’t have to. The resultant mess is not really telling you anything, and don’t even think about adulterating them further with ad-hoc art work.
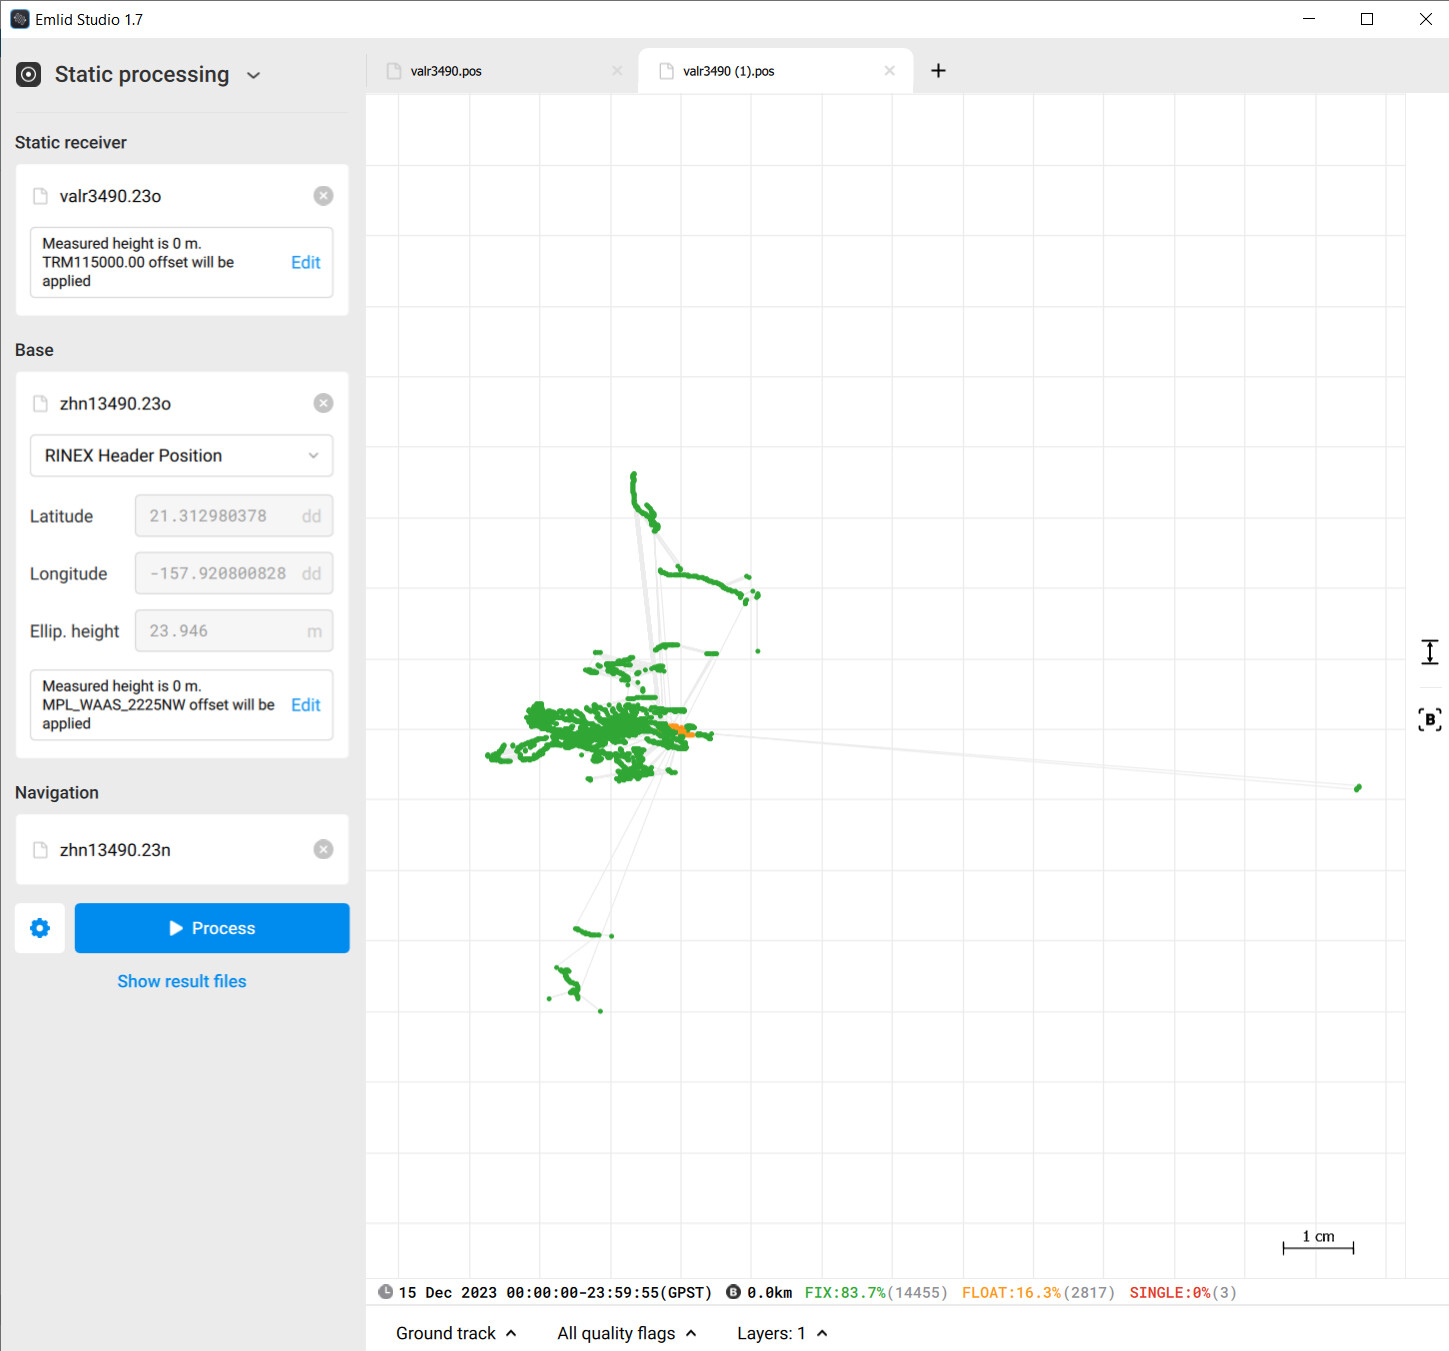
Your rover is squatting on a single point. For long observations over relative short baselines between quality sites like this you should be processing Static, Single position, Fix & Hold. Let it focus and use all time it has to converge down on that point.
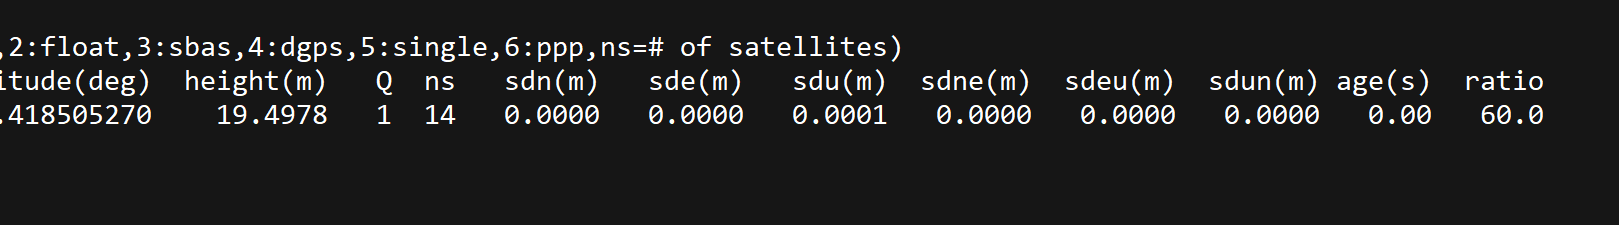
Then what you should be looking for are low standard deviations and ratio something like this to give you confidence in the point:
This one was a 10 hour observation over a 13.8k baseline and the result 5mm from true.
Make changes if you are not happy but ultimately go with the best result / lowest numbers.
Then compare the results with the published coordinates of your “rover” NPS site. If there is a match then NPS CORS coordinates are also NAD83.
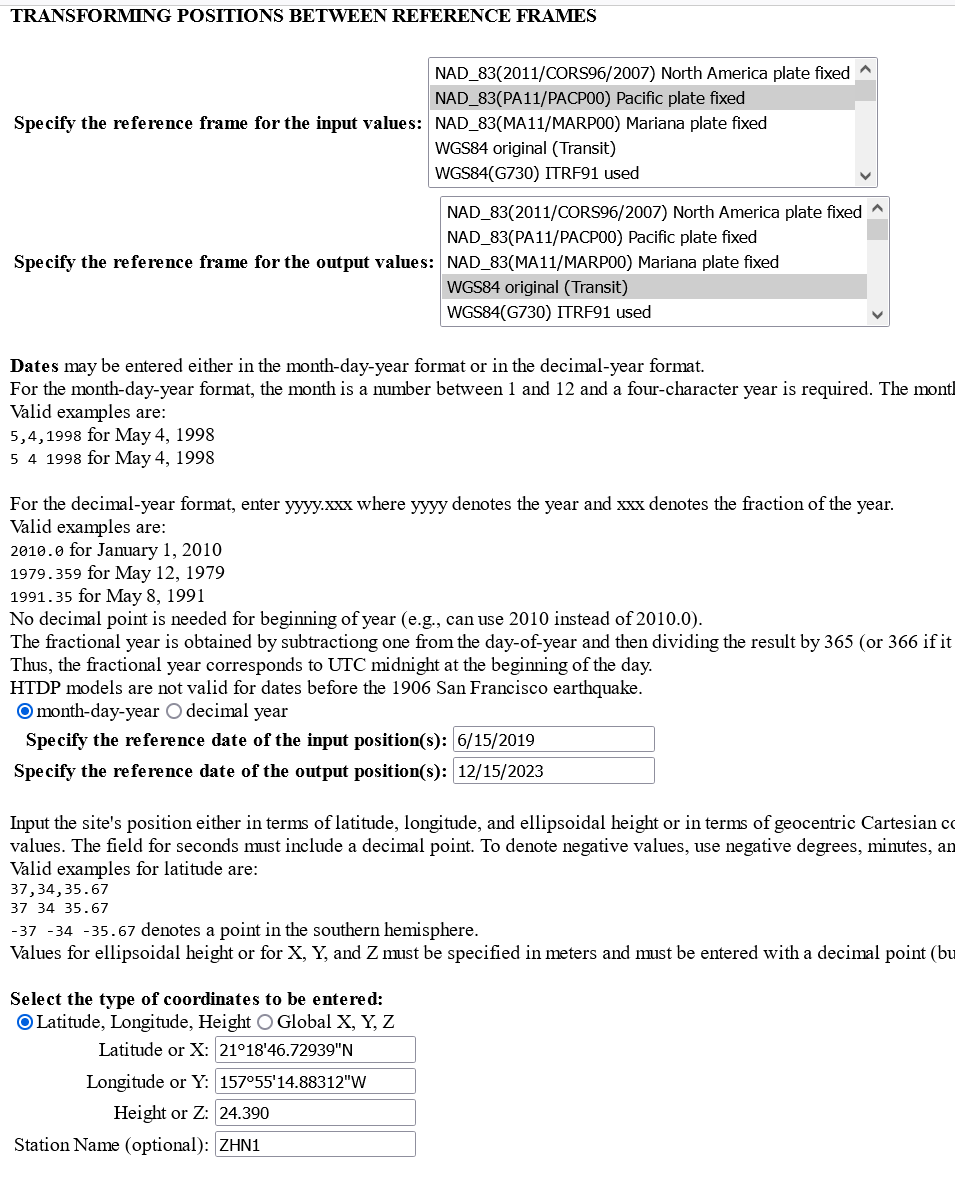
The velocities you are looking at are ECF XYZ and you will be getting way over your head. If you really need to transform to WGS84 then use the NGS time dependent web calculator I sent earlier https://www.ngs.noaa.gov/cgi-bin/HTDP/htdp.prl?f1=4&f2=1
And you could try submitting the NGS obs to AUSPOS
You cannot use a single-band L1 RS+ receiver, has to be a L1 and L2 receiver such as RS2/RS2+/RS3 (OR M2 used with an antenna that has NGS Calibration data).
Honestly @daygeckoart , I think you need to study on the basics of GNSS technology, understanding gnss measurements, observation techniques and post processing.
@timd1971 has provided an excellent link to understanding NGS OPUS processing and gives a good guide for static observations.
Emlid Studio and Rtklib are good free static processors for starting out processing gnss baselines and learning computation methods but are limited in the capabilities that commercial post processors provide. Both are only capable of single baseline processing and have no adjustment routines of observation data for closed loops. However there are a few methods to verify the accuracy of your processed data using a single baseline static processor:
to have any confidence in the computed position, fix ratios should be at a minimum of 90%. Read the NGS OPUS explanation explaining this.
computed baseline residuals are a great indicator of the accuracy of your processed point. Depending on the required accuracy and baseline lengths, anything greater than 5 cm usually indicates a poor solution. Also, residual error of the baseline should be basically equal in all components. Any wide deviation of component residuals usually indicates a poor solution. Large errors in the vertical component is also a good indicator of an inaccurate position.
processing of the data from another passive station mark or CORS will also give a good check on the previous computed position. A simple inverse between the two solutions will give an indicator of accuracy. With two or more receivers, closed traverse loops can also be performed and manually adjusted using various methods , i.e. Crandall Rule, Transit Rule or Least Squares.
observation planning is mandatory for good data. Plan your observations when PDOP levels are at or below 2. Good overall geometry of the satellites (PDOP) is required for a good solution. There are several free mission planning tools available.
Finally, baseline lengths, observation times and observed stations without multipath are critical in any single baseline processor. Clear skies without trees or buildings are imperative for good data. Adequate observation time is needed for a good solution. 25 minutes per 10 km is a good overall guide, even with receivers that are capable of high frequency counts. Too little data will give disappointing results. Baseline lengths should be as short as possible as they are generally more accurate with appropriate observation times.
Without using the above methods, you are basically guessing at the accuracy of your computed solution.
The purpose isn’t to be messy, it’s to show the actual solutions that are being calculated. I don’t think static single position really means there’s converging down on a point. According to how that function is named in Emlid Studio, it’s choosing one point that it thinks is the best. As far as I know, the standard practice is to average multiple points and I’m pretty sure this is what Trimble’s software does. .
This demonstrates what I’ve been saying, it’s valuable to look at the actual solutions vs relying on the software. Even knowing that it’s many different solutions over time is more valuable than letting the software act as a black box. There are “fixes” that are scattered outside the cluster, and “float” within the cluster, which tells you the software is using some statistical methods that may not be the best.
I’m going to try using that website to calculate shift, it will be interesting to see how my own calculations match!
@daygeckoart I thought you had an RS2, sorry my mistake. @timd1971, is right the PPP sites require dual frequency and you won’t be able to process files from your own RS+.
However the errors you are getting are actually from the VALR CORS which is dual frequency and should go through so there maybe something else going on. Are able to upload somewhere a long say pref 24hr observation from VALR?
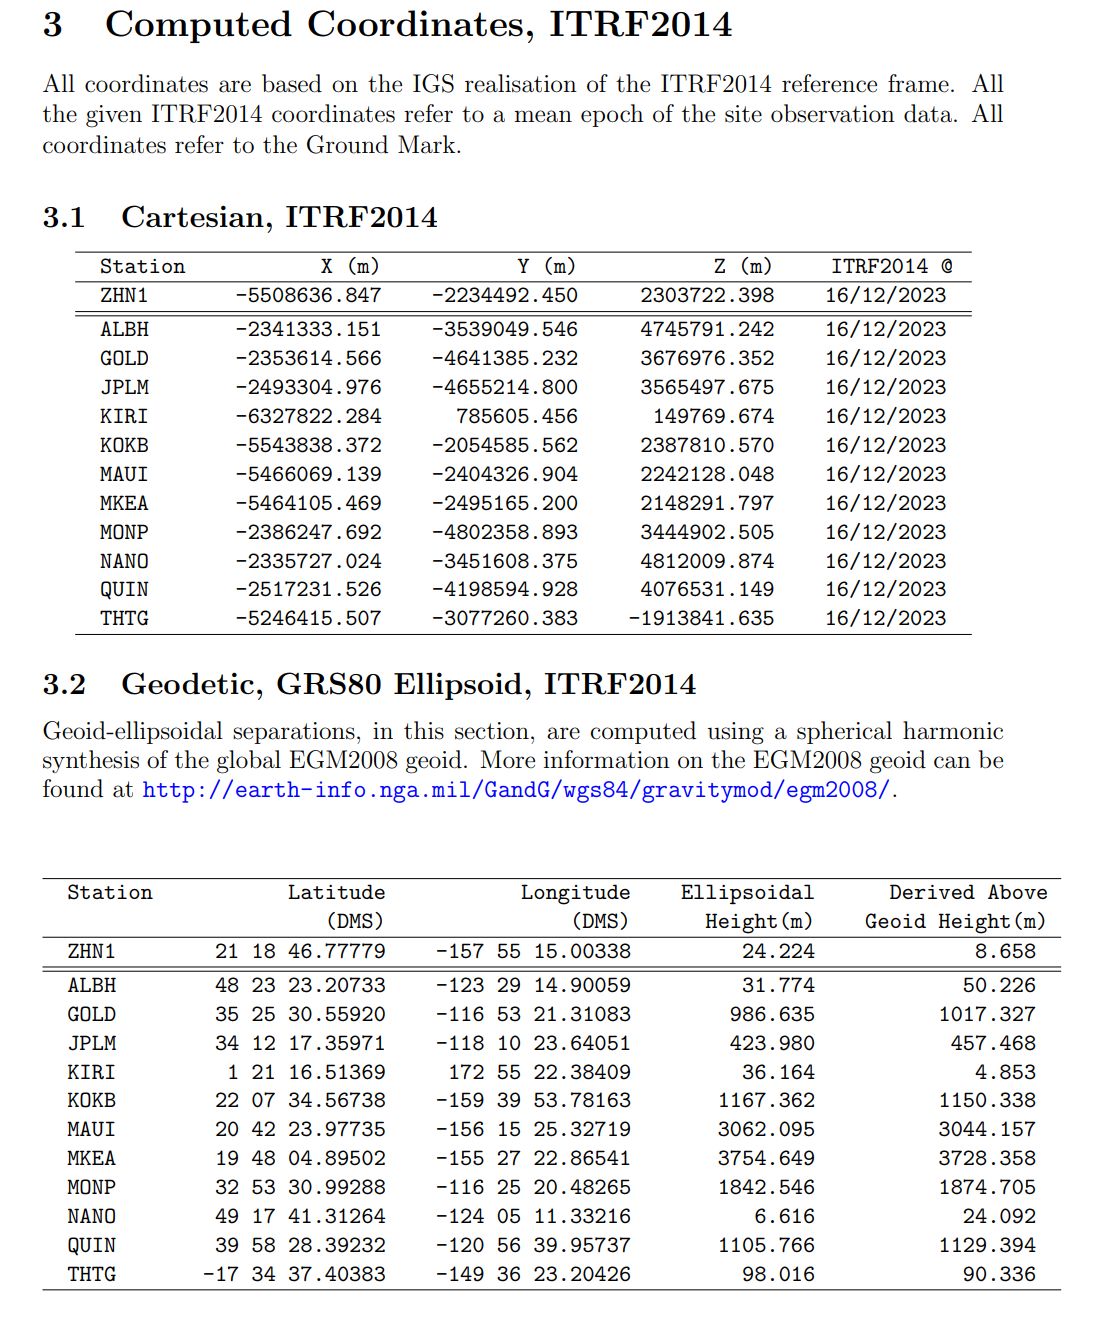
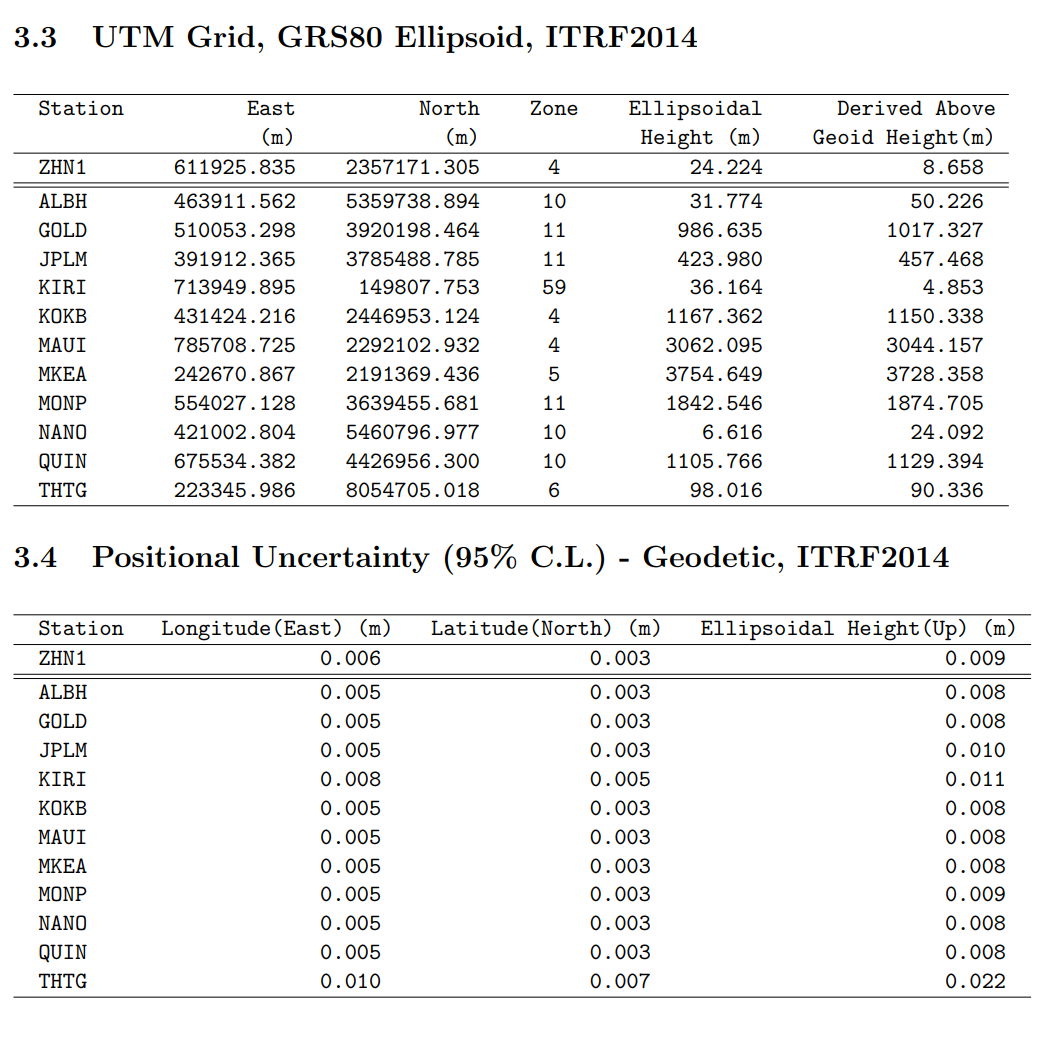
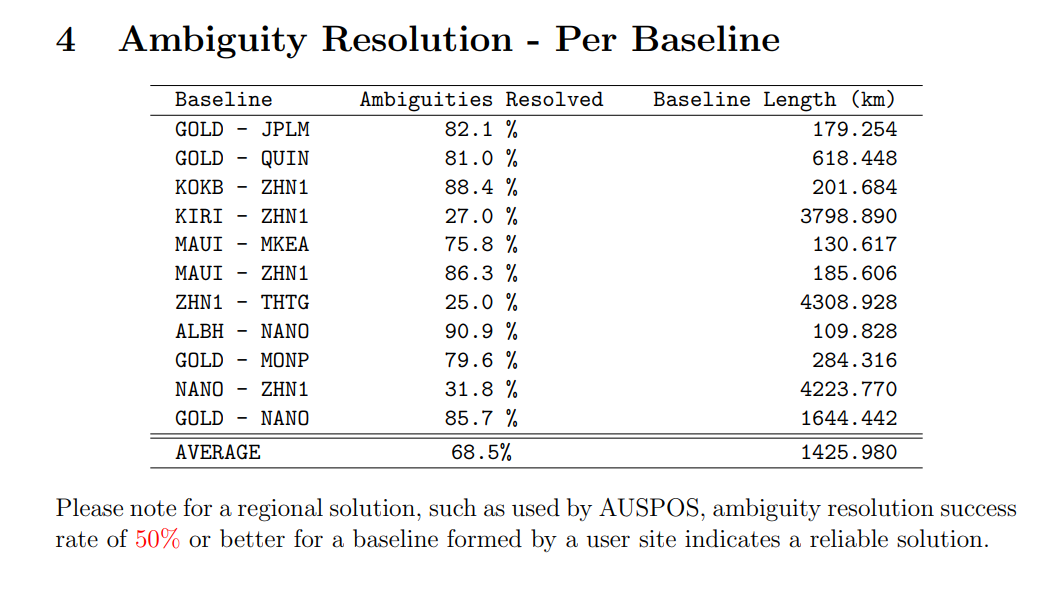
Re the ZHN1 coordinates, this is where AUSPOS put ZHN1 with a 24hr observation on the 16th Dec, but note it’s no longer there it’s now moving moving on:
However, after transformation to NAD83, the AUSPOS results agree to within 11.6 mm of the ZHN1 RINEX file NAD83 coordinates …which according to the site data were established back in June 2019. So all the same, consistent across sources and no fuss and why you should use them.
Regarding the averaging I think you are confusing Trimbles TerraSync device software which has an option to average a point at collection, but there are no options to mess with the postprocessing with PFO…and certainly not to anally pluck out random parts of any point. Nor with the current survey tools Access and processing with Trimble Business Center.
You really should stop jumping to conclusions and particularly in regards to random point art. The software is extremely smart and actually does what you are attempting visually, but it’s actually the reverse and done with numbers. In simple terms think of the concept of the software looking for patterns that make sense, but that add up mathematically. And the more they add up the more that point will shrink as all those technical thingy’s like residuals and SD reduce until it becomes laser sharp…and not noticeable amongst all the pretty colored blobs you that seem to get your fancy. And yes, there are things you can do to smooth the process and help the software but you need to learn them.
You seem keen and are delving into detail but you are blocking yourself and need to break though the perceptions. People here are taking the time to give you good advice and pointing you to more expert advice you just need to take up.
I have an RS+ that belongs to me and two donated RS units that belong to my workplace. But yes it’s the VALR data for 24 hours from Dec 15th that I tried to run through OPUS.
I uploaded 3 days of VALR data, Dec 15, 16, 17 here VALR - pCloud
I am taking up expert advice, but you may be making assumptions too. You said the software is doing what I’m doing manually, but I haven’t been able to find any documentation of the processes.
I just want the ability to convert data easily. I went out and gathered a tracklog for a tree inventory, but was unable to connect to the RS wifi, so there is no project file or CSV. But the CSV is just a way to group log times to generate points, whether it’s by averaging or whatever method. Being able to select solution points with a timeline would let you choose them based on photos or hand written notes.
To compare the VALR and ZHN1 stations I corrected the same 18 hour collection with both, using single best, combined forward backward, and fix & hold. The results are within 1cm horizontal and 2.5cm vertical. So whatever error comes from not having WGS84 current coordinates for these stations seems to be a simple shift
All within a few cm of each other. That’s basically noise level and you can assume the header coordinates are NAD83(PA11)(epoch 2010.0) and just go with them. Any differential processing you do using the VALR base station and it’s header coordinates will always give you NAD83(PA11)(epoch 2010.0) coordinates.
You might be missing the fact that you don’t care about moving plates if your rover and base are on the same plate. The motion cancels … well mostly.
If the NPS changes the header coordinates - like with a new official system - differential corrections will change to that system.
Thank you, so the coordinates are NAD83 PA11 Epoch 2010 which is the same as the ZHN1 station.
So how does Emlid Studio know that’s the coordinate system? And does it then convert those coordinates to current WGS 84 in order to do its PPK corrections? Because Emlid Studio only works in WGS 84, or as Wombo said, “WGS84 is intrinsic to all GNSS devices”. Is the software adjusting the known coordinates of the base station by adding the shift over the past 13 years?
Emlid Studio doesn’t actually know the coordinate system. It assumes it’s WGS84. Why does it work for NAD83? Because the ellipsoid is essentially the same. Simply put you can project a NAD83 coordinate on the WGS84 ellipsoid and get a NAD83 coordinate. As long are the distances aren’t continental.
The systems have a different origin in the center of the earth by a couple of meters. That’s completely negligible when doing the math for projecting points on the earth’s surface which might differ by even 100 km.