Hello.
I am evaluating the M2 receiver as a base and I came across some features that I would like to share.
The methodology was to occupy a landmark of known coordinates and to compare the RMS deviations from RTK positions carried out in relation to three base stations of the RBMC-IP network: (1) distant about 18 km; (2) distant 200 km and (3) distant 500 km from the landmark.
Two sets of results were obtained: (1) generated directly from the receiver by REACHVIEW 2.22.4 (LLH set) and (2) obtained via RTKNAVI (V. DEMO-5 B33-C) on a Windows 10 PC; on the same WIFI network the receiver was on (NAVI set).
Two antennas were used: (1) helical Tersus brand model AX3705 AX3705 GNSS Antenna | Tersus GNSS (TERSUS) and (2) Navspark model GRADE ANTENNA - http: //navspark.mybigcommerce .com / survey-grade-antenna / (GRADE), both capture signals from the GPS (G), GLONASS (R) and GALILEO (E) dual frequency systems.
I performed 7 occupations of each antenna in RTK realization with each RBMC base (…) over 1 hour each, at different times with a frequency rate of 1hz; totaling 42 occupations and more than 350,000 RTK solution points.
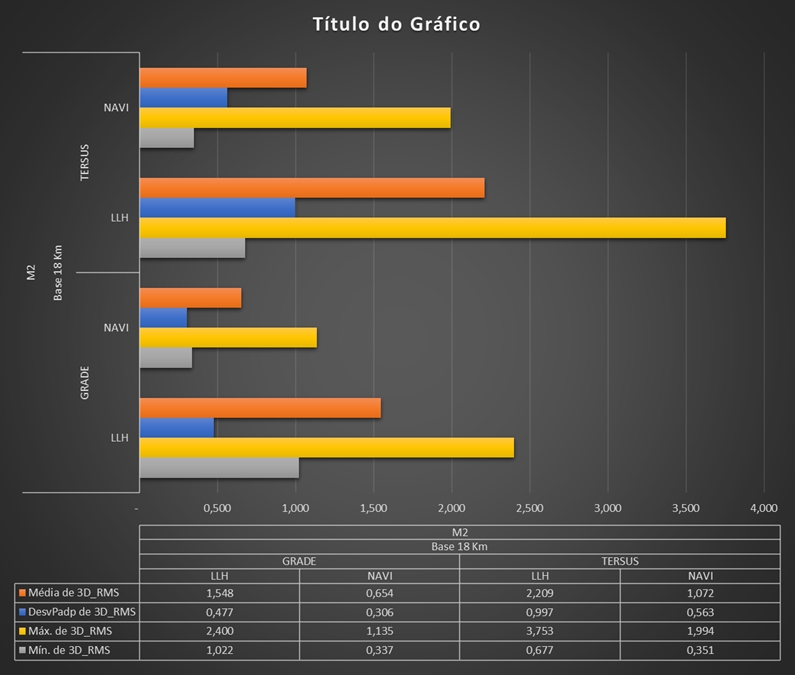
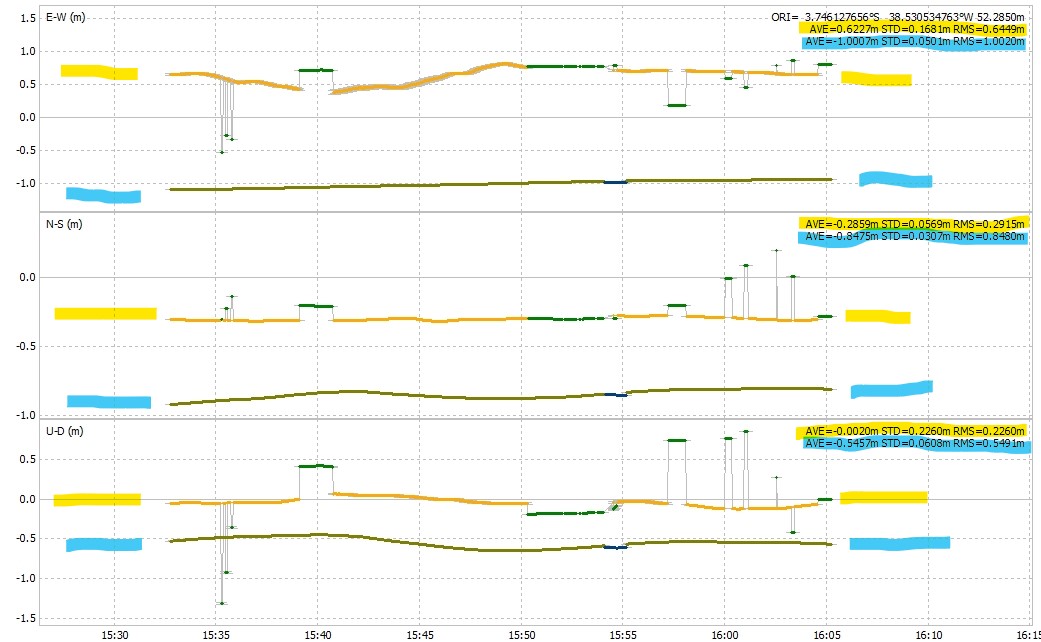
For each occupation, the RMS dispersion values of the E-W; N-S and U-D vectors were obtained with respect to the known coordinates of the landmark. These values were tabulated and allowed to evaluate the dispersion of the solutions obtained in each processing, generating 84 sets of position variation data, 42 LLH and another 42 NAVI.
What is striking is the difference between the quality of the positioning of LLH results compared to NAVI: on average, the RMS deviation obtained by direct processing at the receiver (LLH) is about twice as large as that of the NAVI set, obtained on the PC (…) and for the shortest base distance (about 18km), the effect is much more noticeable!
The figure below shows the three-dimensional averages of the RMS dispersions of the various surveys in relation to the base distances. The diameters of the circumferences indicate the standard deviation of the averages.
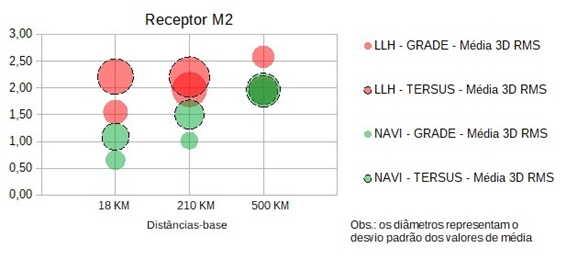
Regardless of the antenna (TERSUS or GRADE) the LLH results (in red) are worse than those obtained in NAVI processing (in green).
For the base distance of 500 km the difference is less noticeable, indicating that similar results can be obtained with the LLH or NAVI set (…) while for a distance of 18km, if only using the LLH data, double error is obtained than if using a PC with RTKNAVI.
The same strategy is being used to evaluate M+ receivers and first REACH module; with single frequency antennas.
Preliminary data indicate that the difference, in single frequency receivers, is no more than 10% and without a trend (there are times when the LLH set is better and others when the best is NAVI … indicating that the difference can be caused by other reasons: satellite geometry, antenna quality, etc …)
My intention would be to use M2 without the need for a PC - generating RTK solutions directly from Reach View (LLH) … but given the results, it seems that I will need to change my intentions!
I hope that the next versions of Reach View can better handle RTK solutions and generate more accurate data.