I thought you were joking since your such a joker!
But you never know is why I asked. ; )
I thought you were joking since your such a joker!
But you never know is why I asked. ; )
Hi.
In your second example.
Do you use continuous mode in your two antennas, base and rover? Or only in one of them (Rover)?.
Regards
Only Rover
Base does not have any correction, thus no mode to be applied (continuous or fix&hold)
Thanks Tore.
Hi Tore.
To carry out stakeout you recommend, continuous mode or fix and hold?.
In this case, I need it to be as accurate as possible.
Regards
Continuous!! 
Hey there!
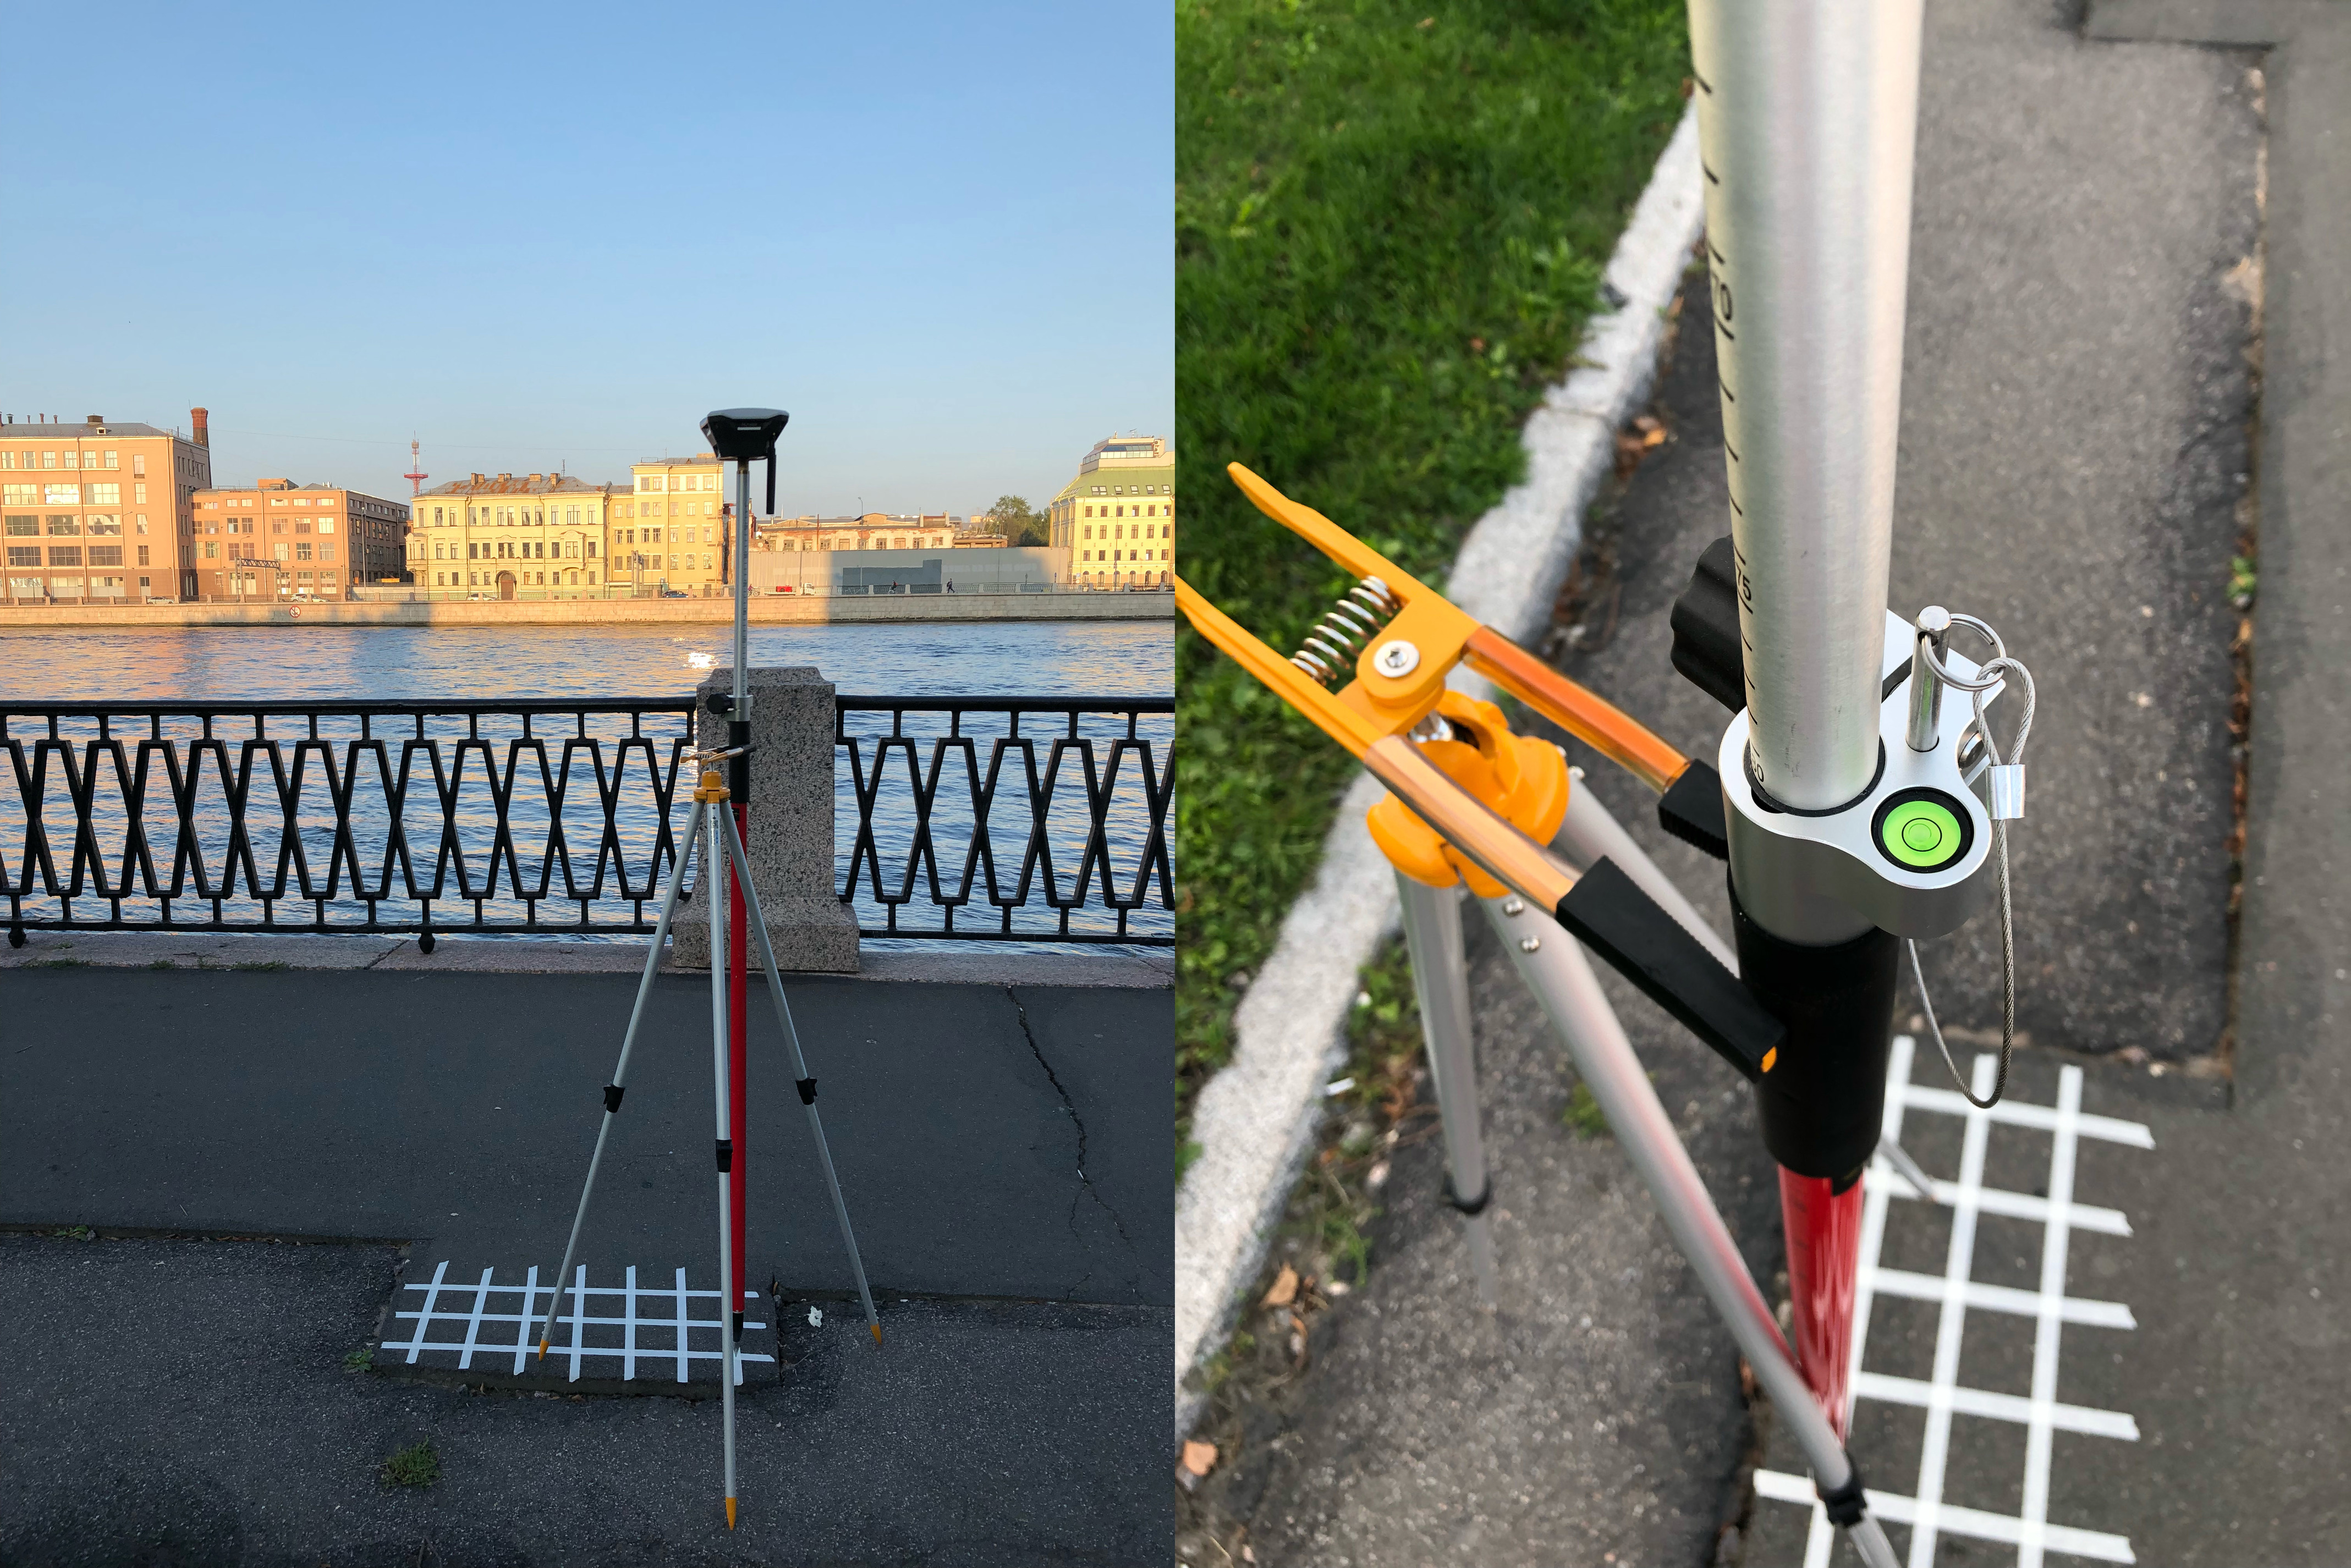
Since @TB_RTK started this thread, we were interested in replicating it here nearby our office in urban environments.
So finally I replicated the “Fix-and-Hold vs Continuous” test a couple days ago with the great help of @andrew.yushkevich.
I used 2 Reach RS units with ReachView 2.15.2 dev version.
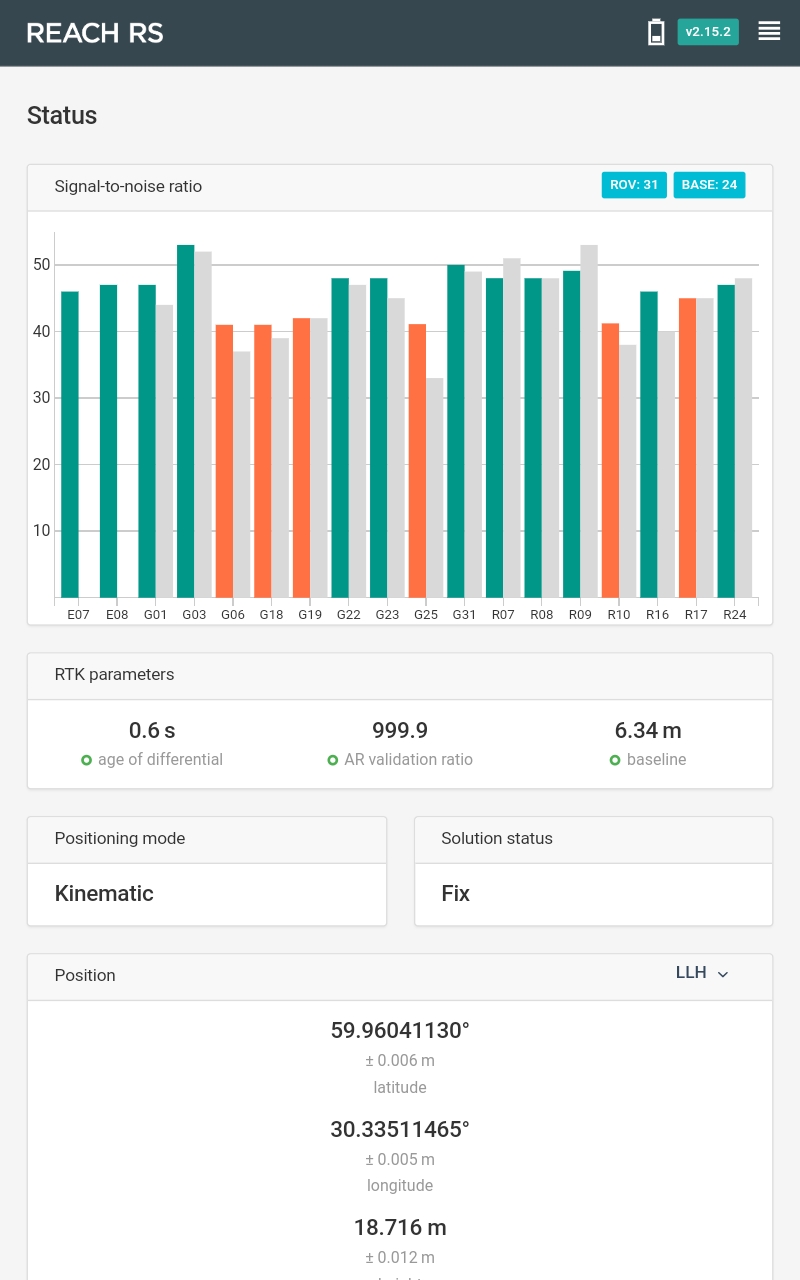
The base position was averaged for 10 minutes.
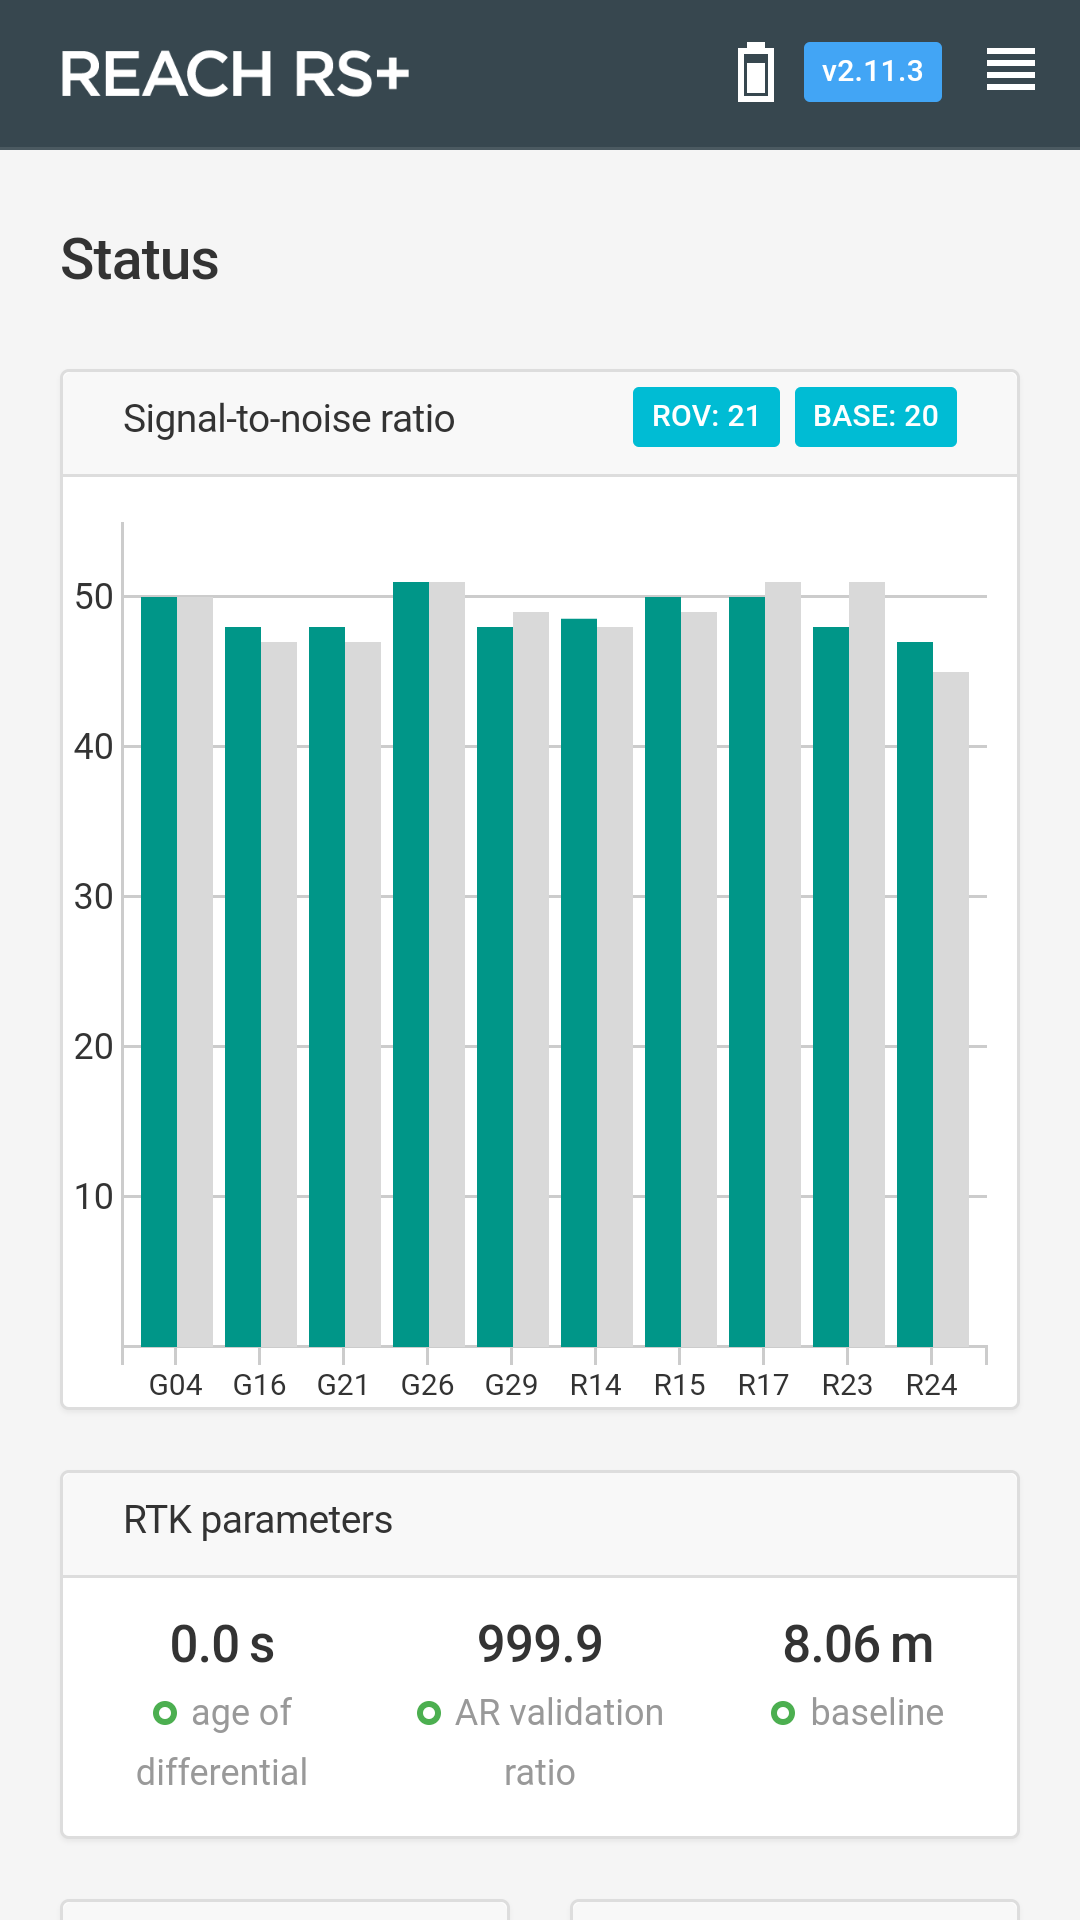
RTK settings for both base and rover were:
GNSS select: GPS, GLONASS, GALILEO, SBAS, QZSS with 5 Hz frequency update rate.
I used the grid you can see in the image below. I collected points with 20 cm spacing between them as in the @TB_RTK test.
Each point was collected for 1 minute using the Survey tool of ReachView app.
I had fix solutions for both Fix-and-Hold and Continuous during the survey process.
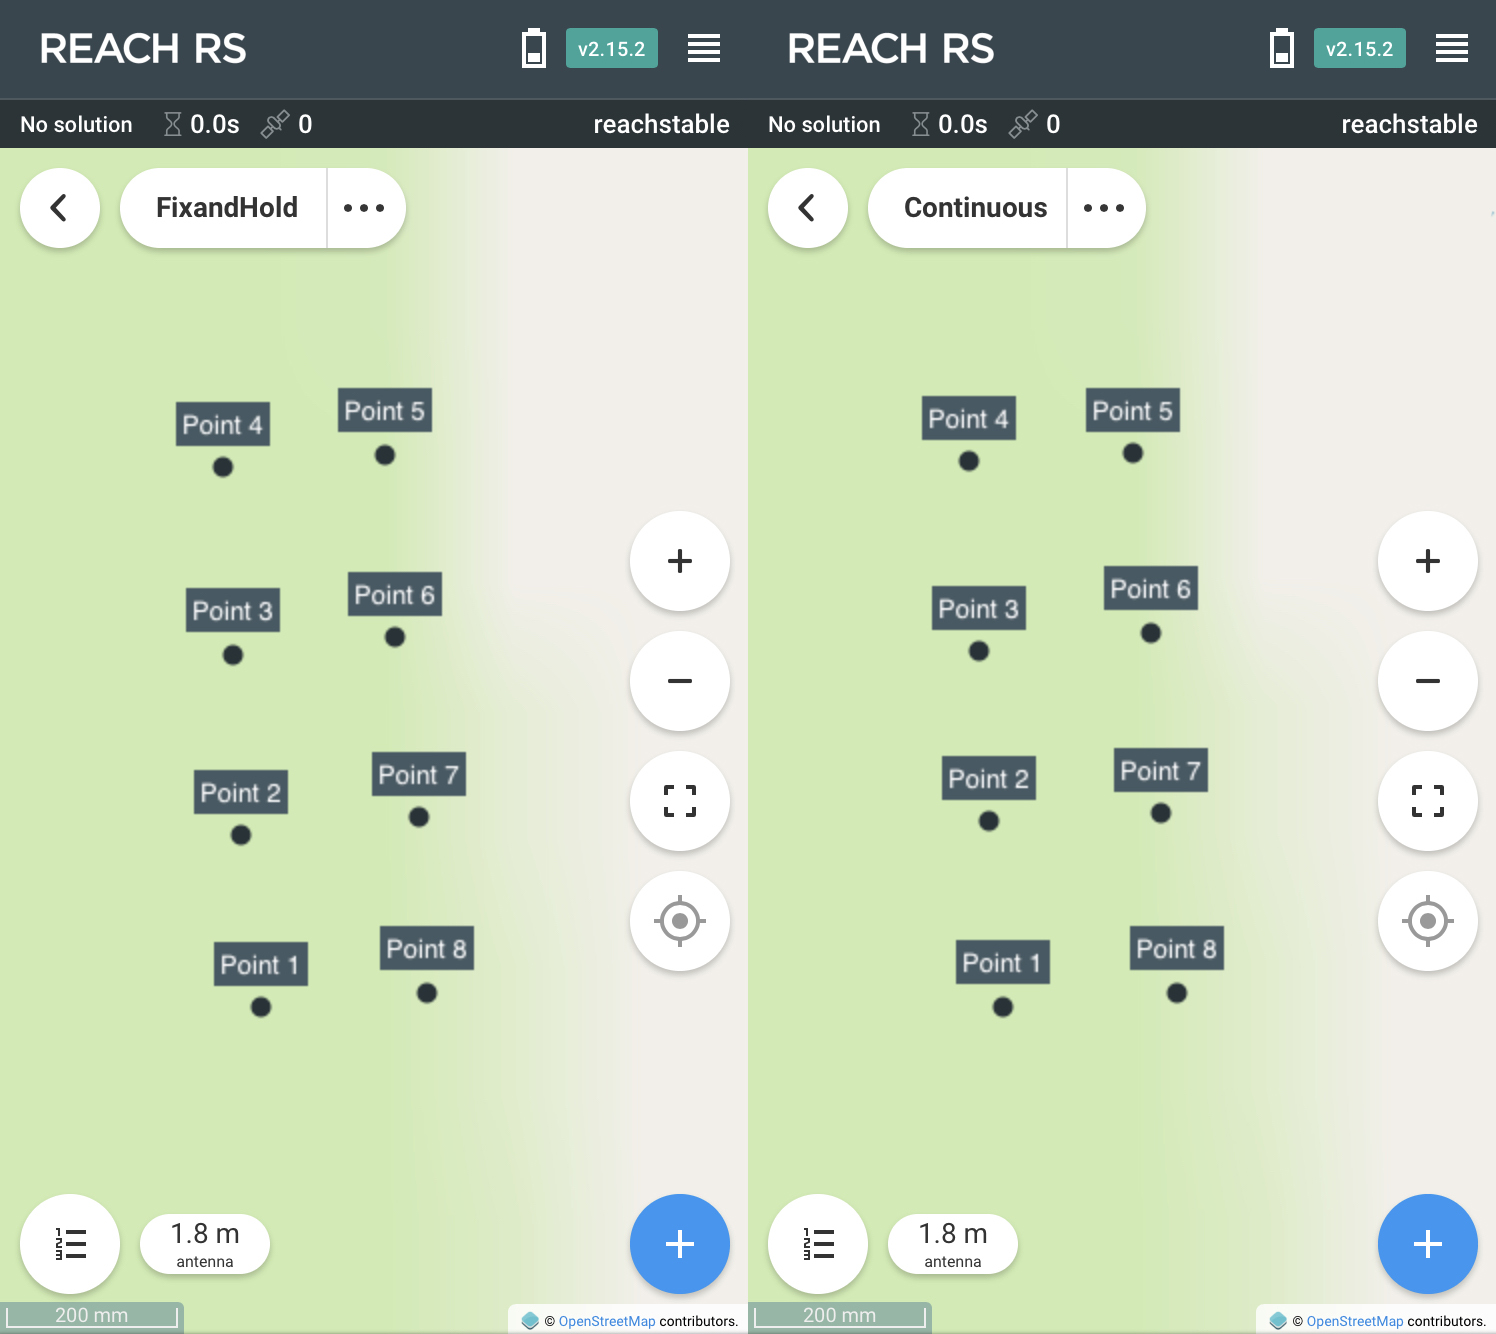
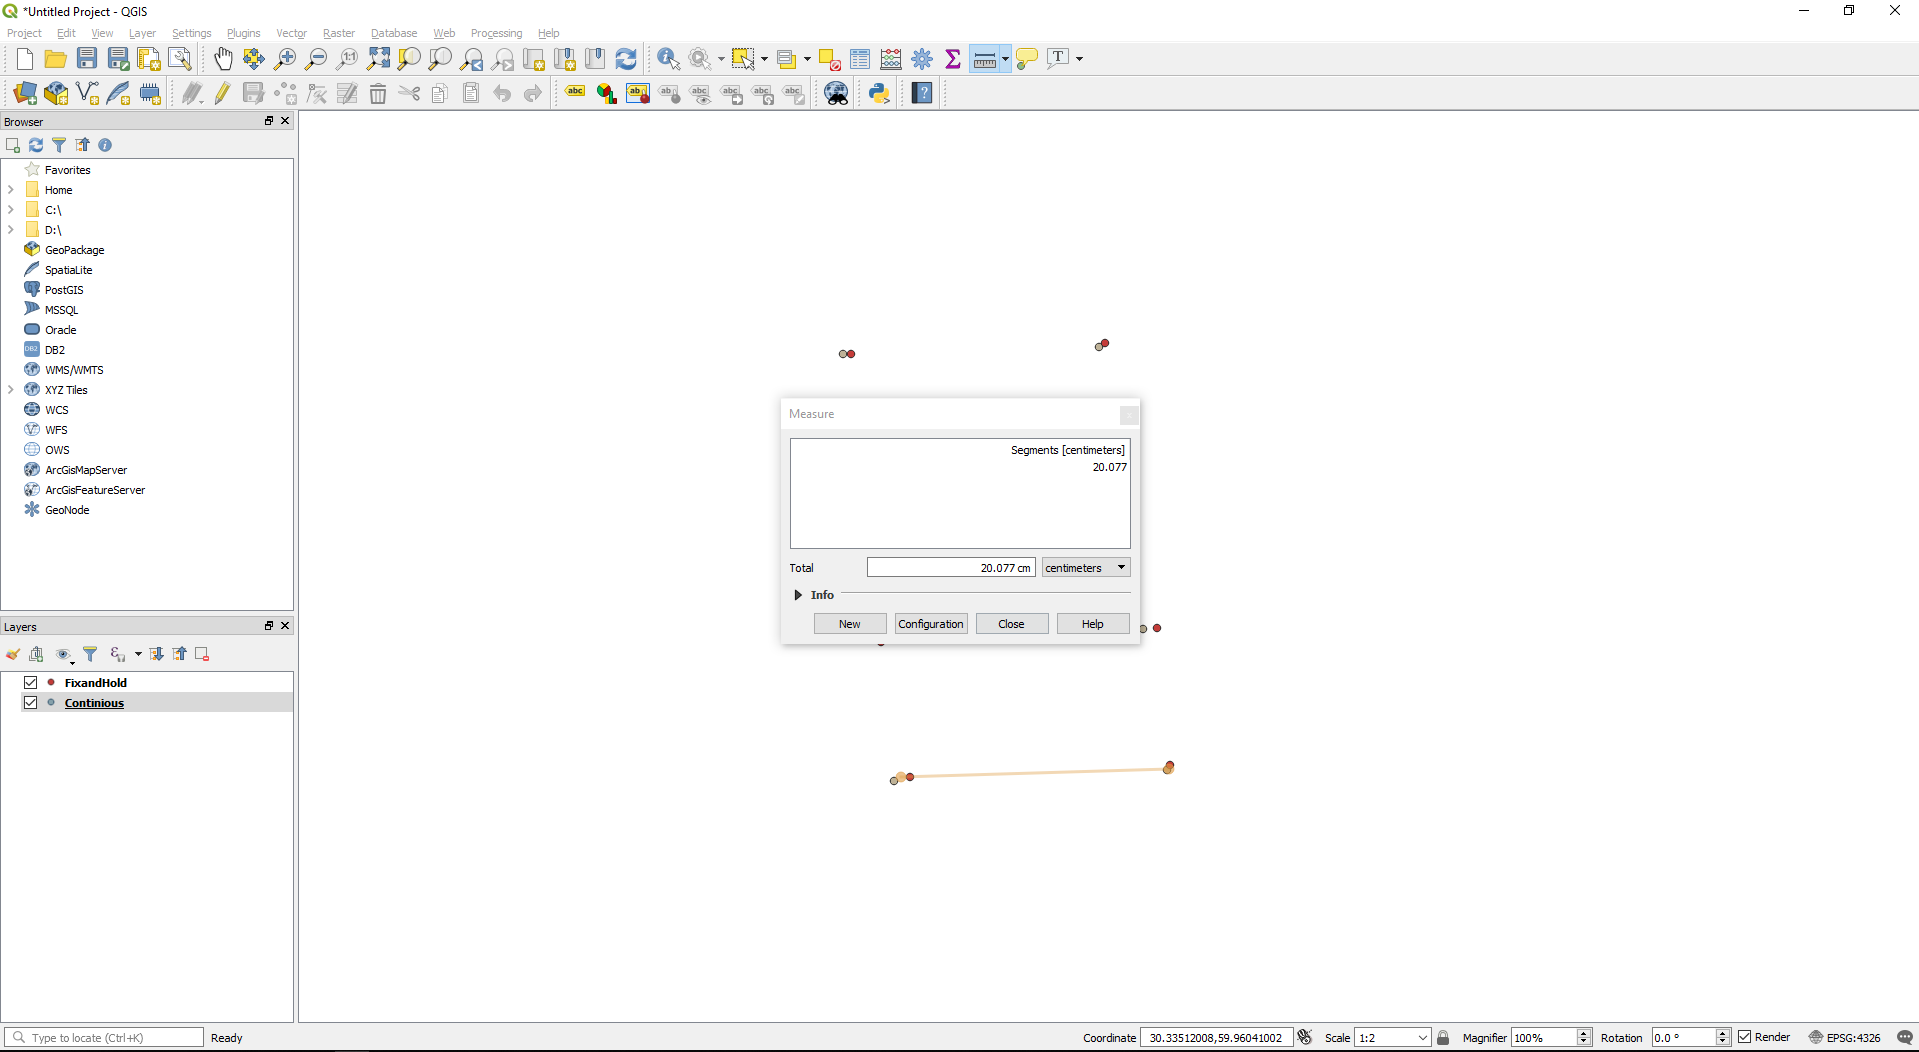
Here you can see the result of both Fix-and-Hold and Continuous surveying:
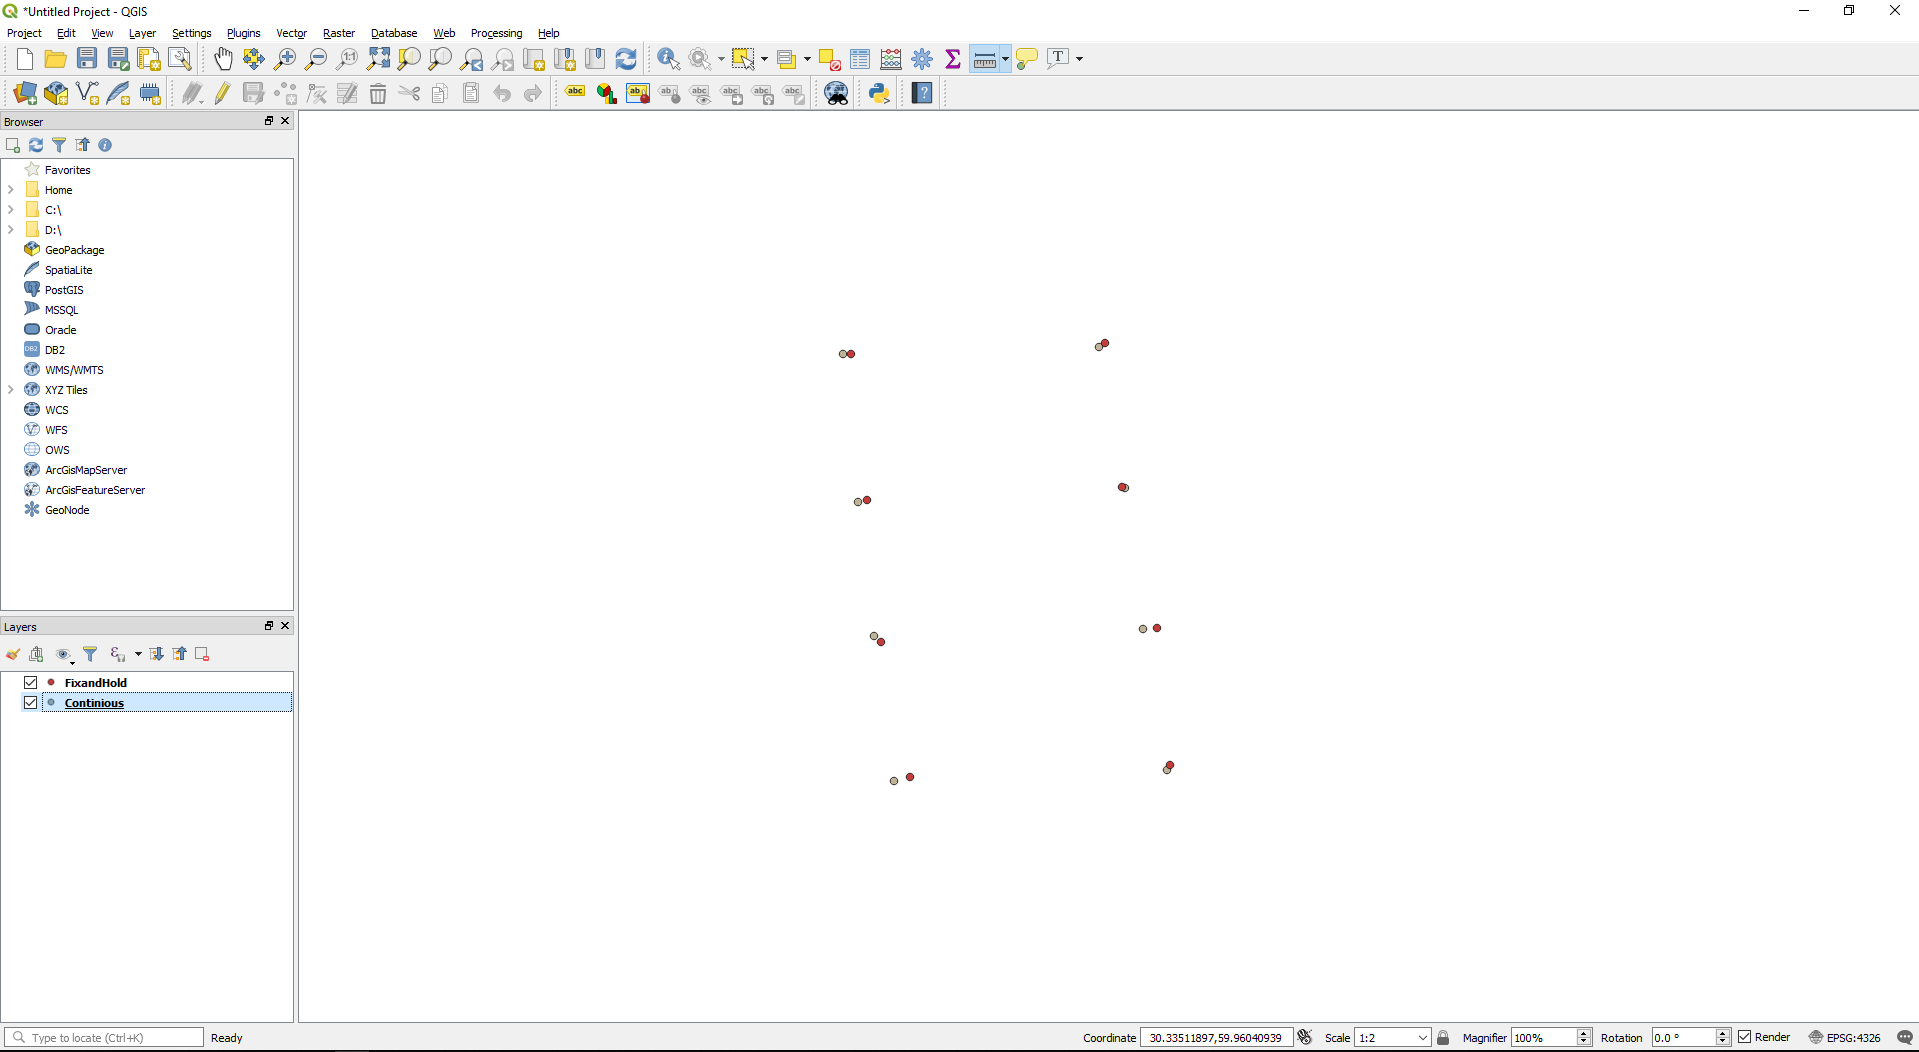
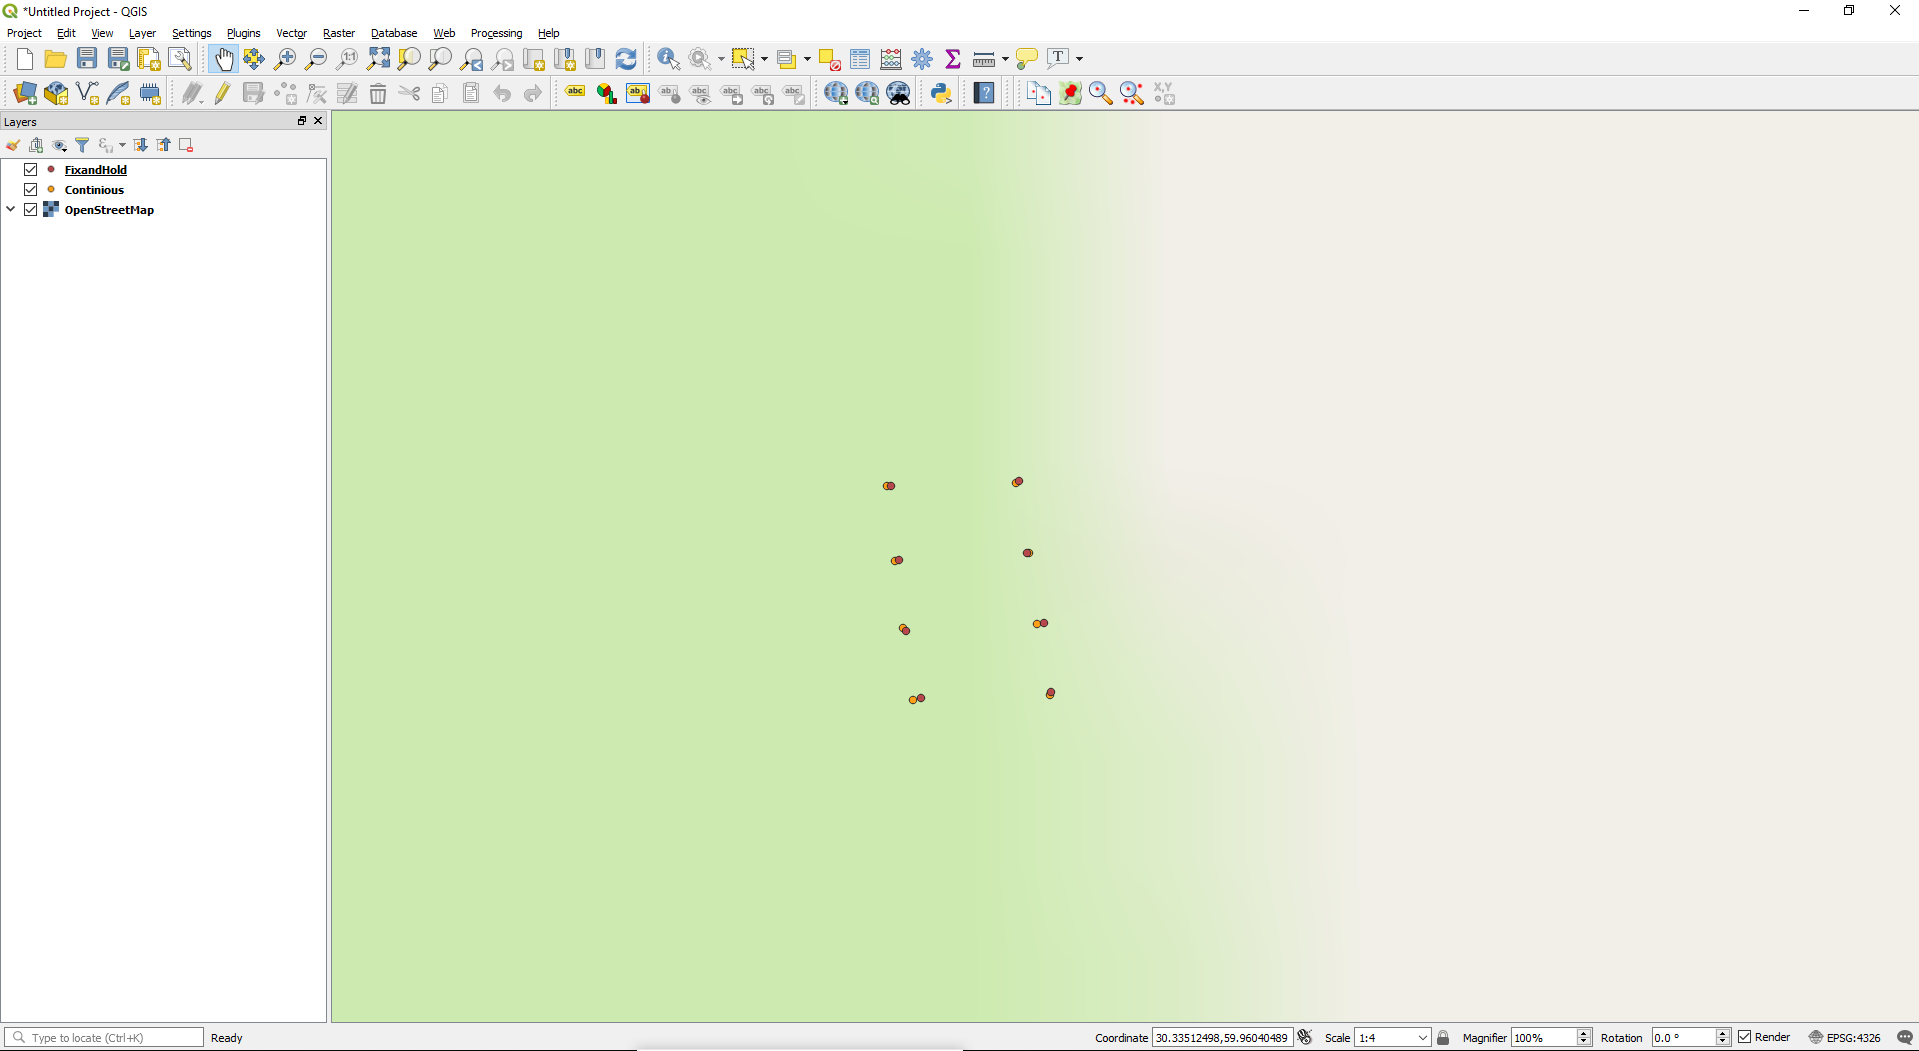
Imported to QGIS results:
As you can see from the screenshots above, I didn’t manage to get the shift in a position for both Fix-and-Hold and Continuous.
So I think we can’t fairly judge that Fix&Hold is not as good as Continuous. Data quality depends on environmental conditions, settings and many other factors and in some cases switching between 2 RTK modes won’t give the desired result.
In the end, no matter what mode you use, here are some general tips on how to make sure you collect good data:
Important point i would say ![]()
Nice retest btw ![]()
![]()
This awesome. Good job.
Just curious, the results in QGIS import appear to be not proportional to the measured points in ReachView? Appear wider than taller and not square in proportion? (Or should I say shorter than 20cm, since it measures 20cm wide each) Something I’m missing?
Either way, so impressed with accuracy from the Emlid Reach RS units. : )
Isn’t that just projection difference?
I would assume if it was rotated in 3D maybe? (away from view?) But shouldn’t it be pretty much SQUARE as in the ReachView Survey as shown…especially since such a small area?
maybe the screenshot images aspect ratio were scaled out of proportion? i.e. squashed vertically?
Hi @timd1971,
@wizprod is right, that’s reprojection result.
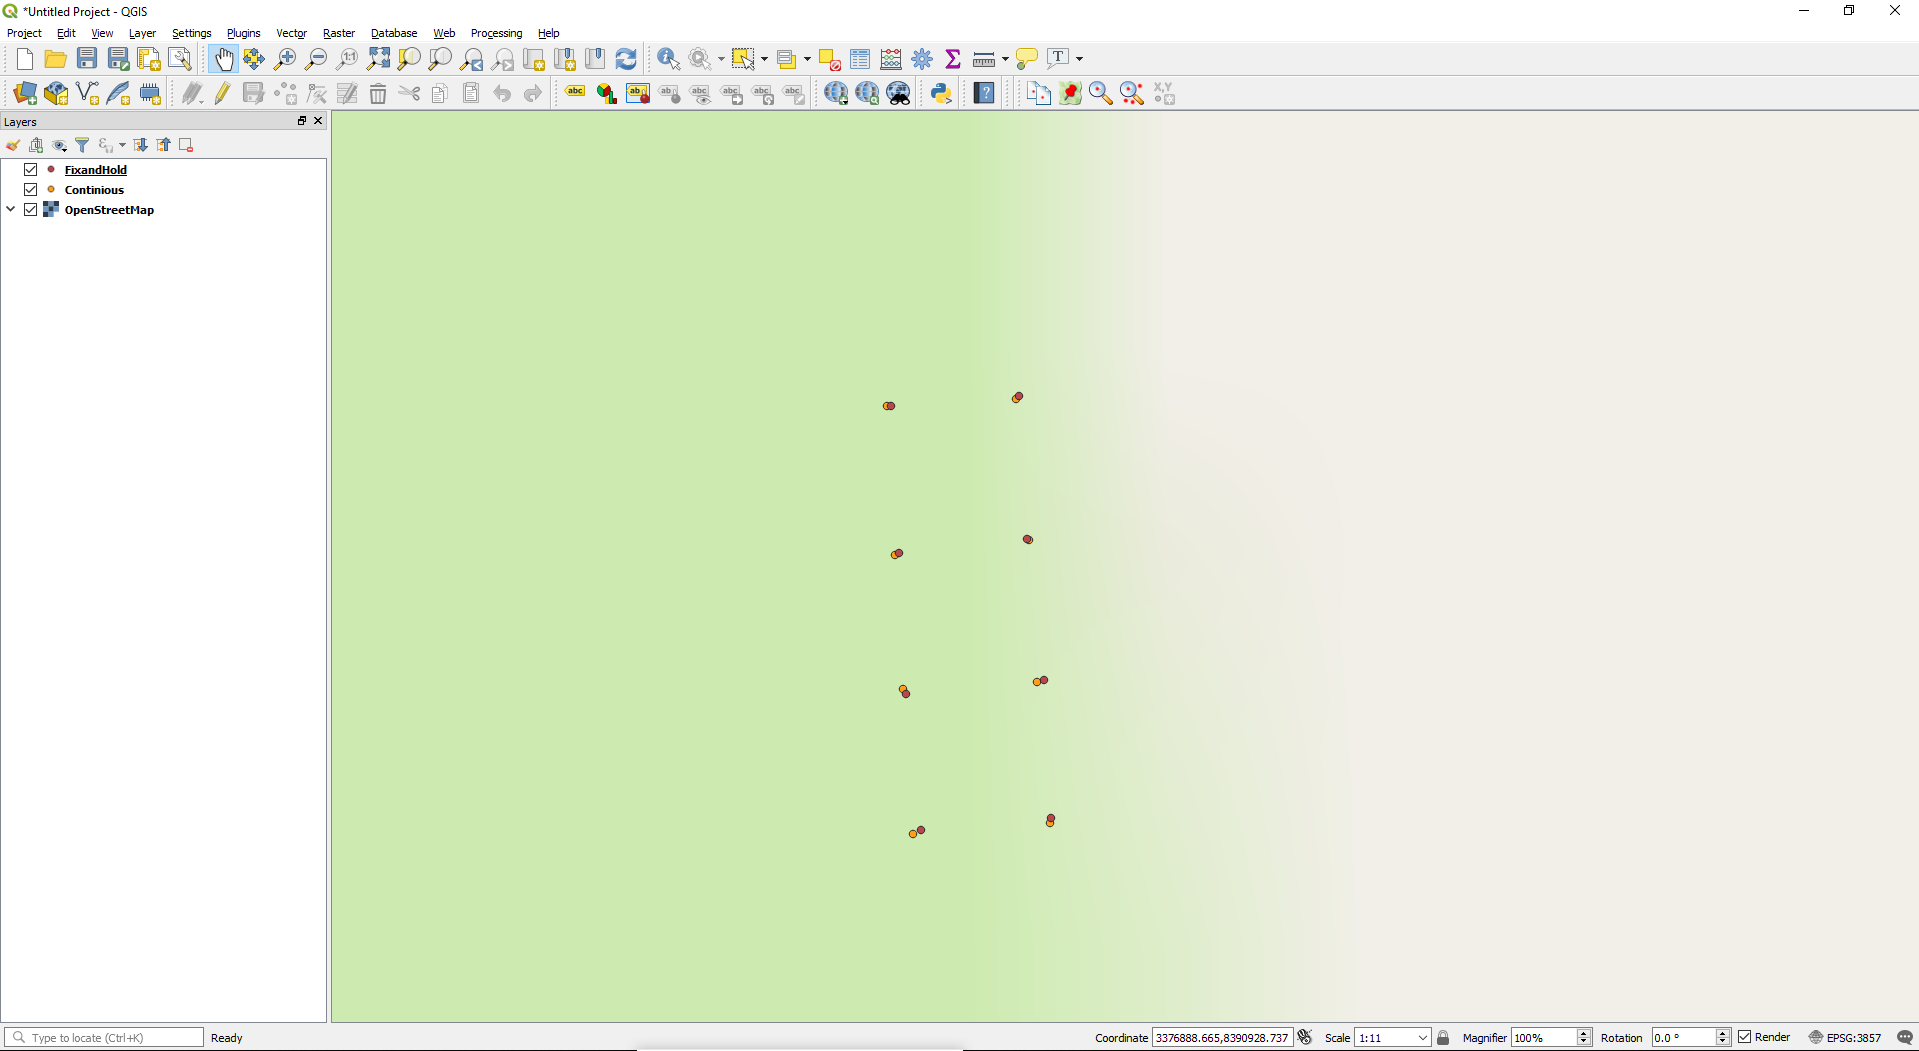
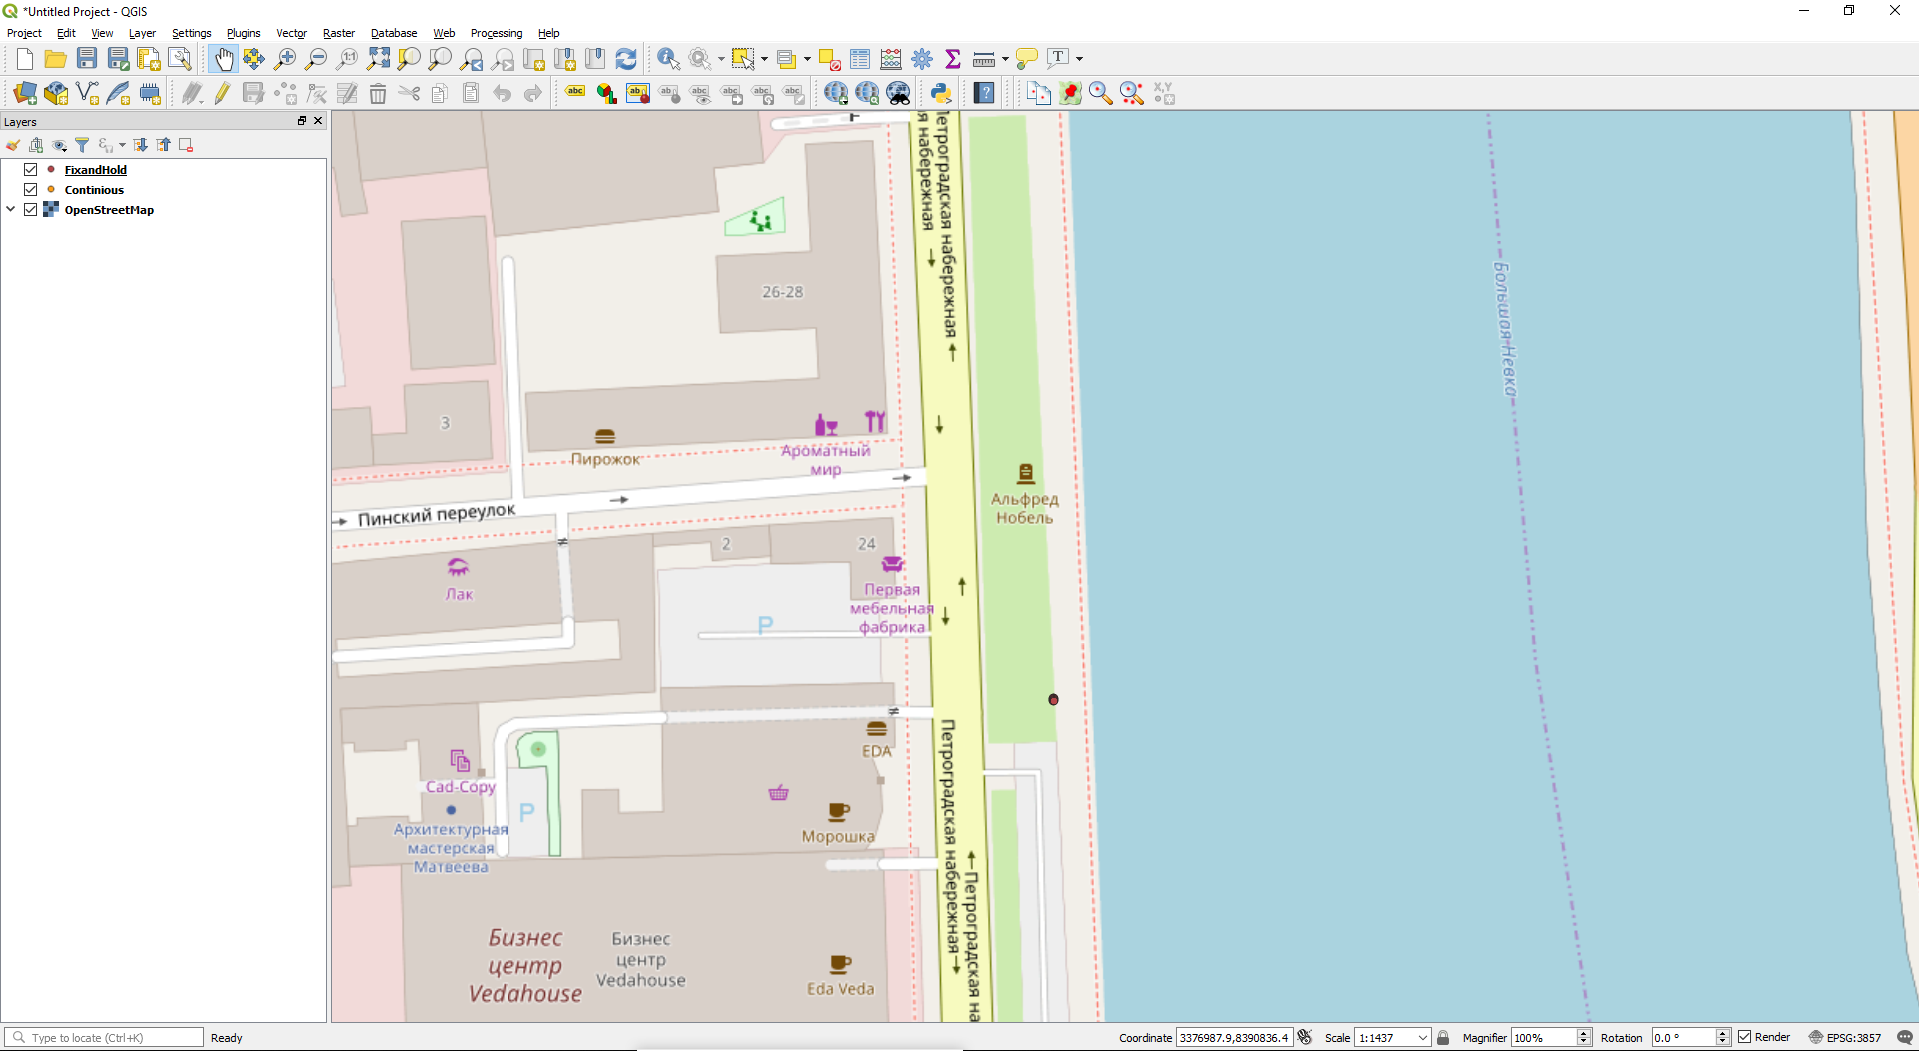
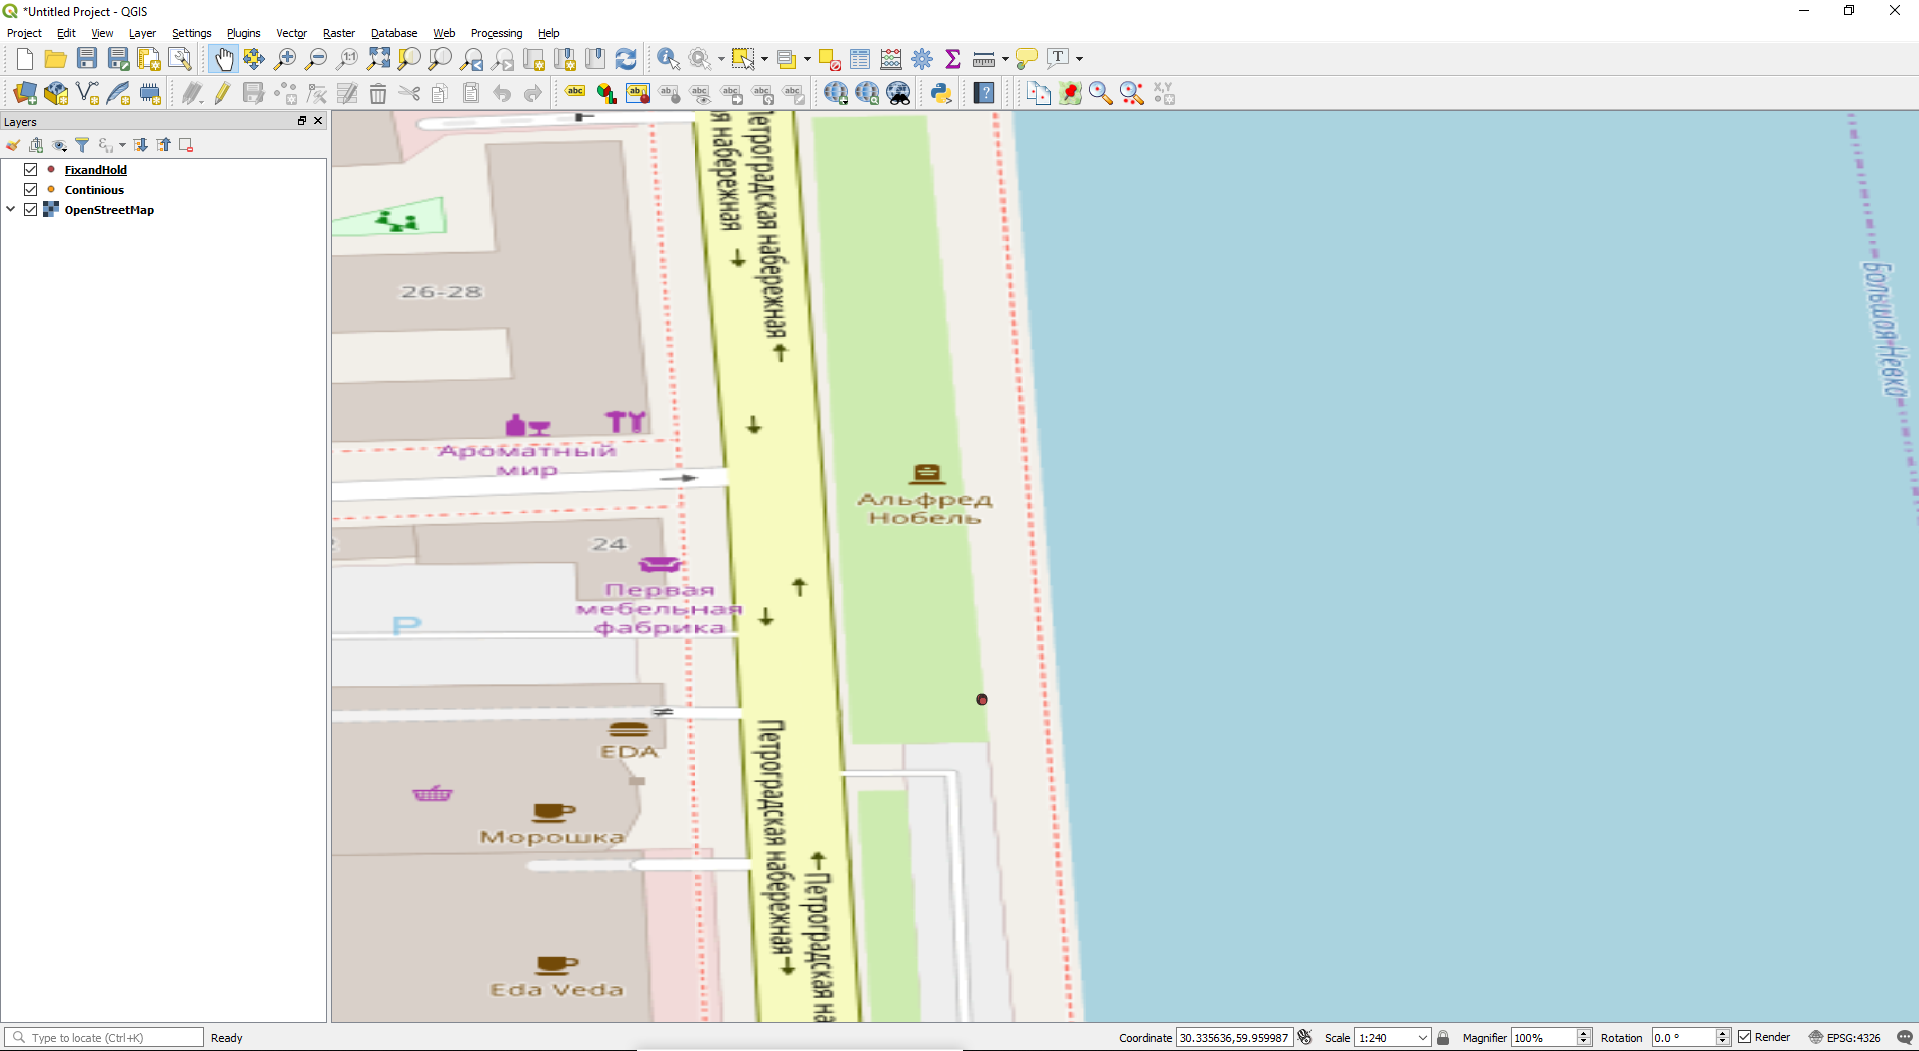
Open Street Map in ReachView is in EPSG 3857 and points in the QGIS test are in EPSG 4326 that’s why you can see the difference.
Most web maps services use WGS 84 / Pseudo-Mercator (EPSG 3857).
Here’re some screenshots which will clarify this point.
EPSG 3857
EPSG 4326
As you can see EPSG 3857 is more convenient for the perception that’s the reason why it’s so popular.
Ok, I see. Seems to avoid confusion and for consistencey for comparison, to just use EPSG 3857 instead of 4326. But at least it is explained now for anyone else that sees this. Thank you!
This topic was automatically closed 100 days after the last reply. New replies are no longer allowed.