if I have a log file of a walk where I left the Reach in different locations for a few minutes each. Now I would like to get the coordinates for these locations. I know I can get the coordinates for for an individual data point, but is there a way to get the “average” coordinate, ideally inclusive some indication of precision (say, standard deviation).
Ideally, I would like to simply select a certain section from a .pos file and get the average position, plus the standard deviation, in RTKPlot. Can I do this?
Use the Time Start and Time End fields to limit your view to the section of the .pos file that you want. Then the statistics you see on screen (if you enabled them) will show all the info you are asking for.
@bide I seem to be doing it wrong.
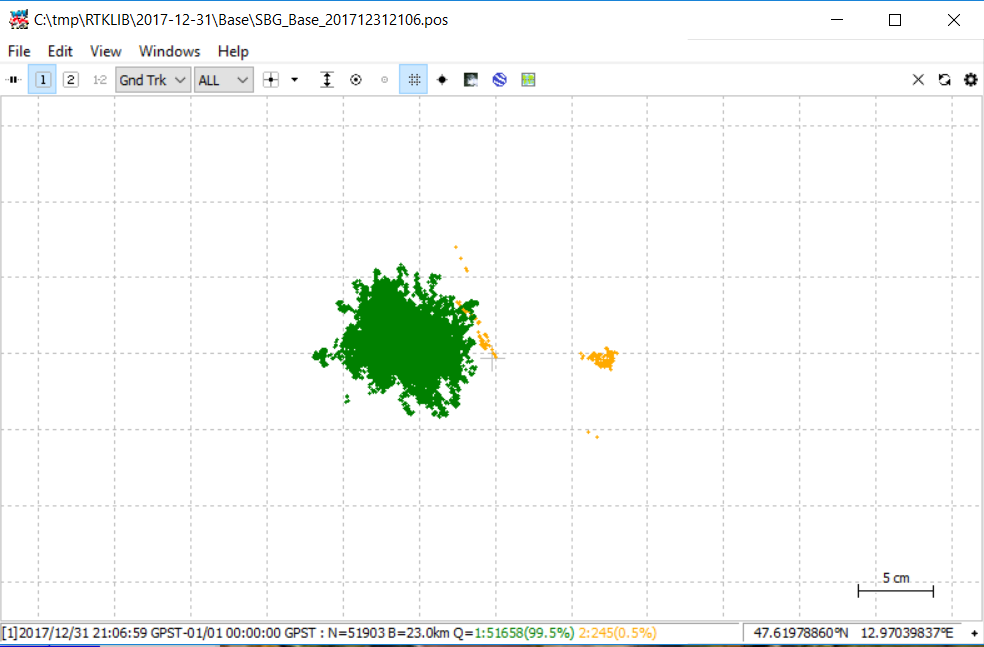
When I do this, I get a coordinate for the current data point (where the mouse cursor is), but not the average of the whole selected part.
Of course I can move the mouse cursor to the middle of the cluster and get a reasonably good position, but is there a better way to get the average position?
For what you want, you need to enable the statistics. Look in the menu. I think:
Edit->Options->Stats->On
The float will be averaged too, so if you don’t want that, then make sure to adjust your start or stop time to exclude what you don’t want (those settings are also found in the menu).
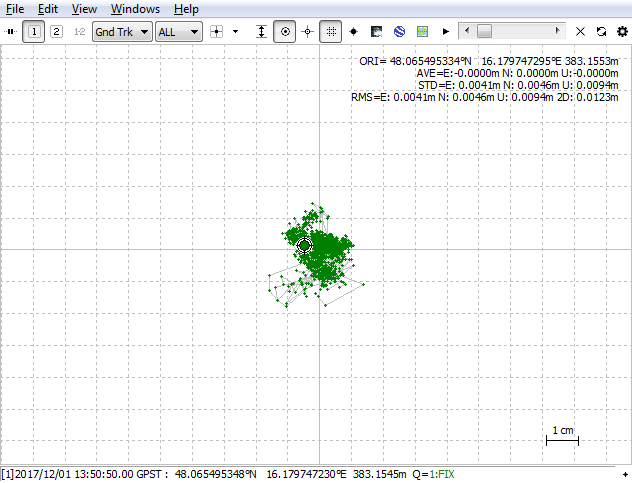
As bide said, one way is to do it in RTKPLOT by enabling the satistics, setting “Coordinate Origin > Average Pos” (both done in “Edit/Options”) and selecting the correct time span. Then you see the averaged position and standard deviation in the top right corner.
Another way would be to open the .pos file in Excel or a similar program and do an averaging there.
@Sidux, @bide, thanks!!
If I interpret this correctly then the ORI part is for the first data point (in LLH format), and the AVE is the average position, relative to the ORI position, given in m?
If that’s the case, is there a simple way to directly get the average LLH position, in LLH format?
Thanks!!
ORIGIN displays whatever you select in dropdown menu. Average,start, end, linear, base etc etc etc.
AVE= average of ALL solution position
STD= Standard Deviation: Standard deviation of the error. Same as one sigma. Corresponds to Percentile 58% in one-dimensional distributions and to Percentile 39% for bidimensional distributions.
Although the mean error and standard deviation are less used as accuracy measurements, assuming normal distributions its use is as legitimate as the other measurements usually used.
RMS=Root Mean Square Error (rms): The square root of the average of the squared error. This measurement is an average but assuming that the error follows a normal distribution (which is close but not exactly true) it will correspond to the percentile 68% in one-dimensional distributions (e.g. vertical error or timing error) and percentile 63% for bidimensional distributions (e.g. horizontal error). For the horizontal error this measurement is also referred as drms and can have variants such as 2rms or 2drms (2 times rms).
Yes
Select average position in the dropdown menu under options. ORI will show the average of all solution. So remember to sort out bad fixes and other float/single solutions that you do not want to impact the final output solution.
@TB_RTK, one more thing:
The universe would be even more wonderful if I didn’t have to type the coordinates off the screen. Is there a way to copy & paste them somehow? So far, I figured out I can manually put a waypoint at the origin and save that waypoint, but is there a more direct way to get the coordinate in a form that can be pasted into another programme?
Thanks!
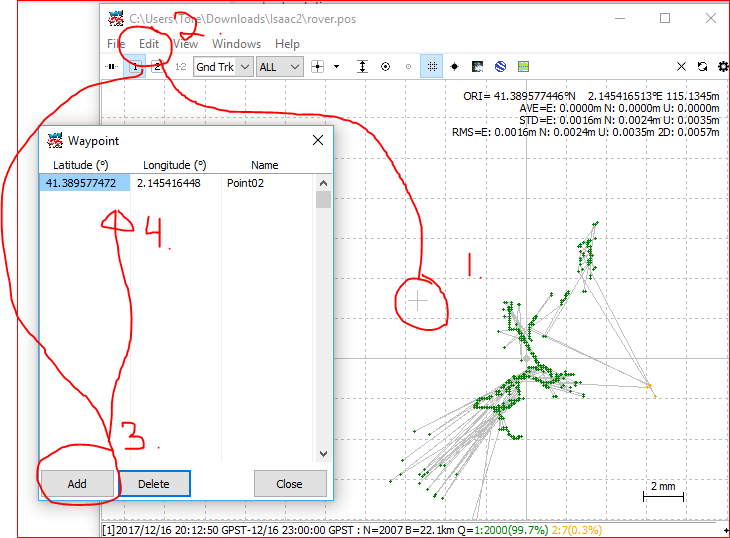
1.move crosshair to desired point
2.click edit and select waypoint
3.click add, new waypoint is where crosshair is placed
3.Final. Save waypoints under file-save waypoints
@TB_RTK, thanks - and thanks for taking the time for the illustration!
I did figure out how to do waypoints, I was wondering if there is a way to get the origin coordinates in a copy&paste-able form more directly than by saving a waypoint and opening the file.
Click view, select center origin, edit and add waypoint or/and then file-save waypoint, either as copy paste from waypoinlist or from .gpx file after its saved. Dont think there is easier way then that. Not with origin average anyway
@TB_RTK, yes, on the level of opening files there are several options. I was looking for a very simple solution (ideally as simple as just copy & pasting the location right from where it’s displayed on the screen, but it seems that text is not in a form that can be selected in Windows…) but it seems that’s not possible. Not a big thing!
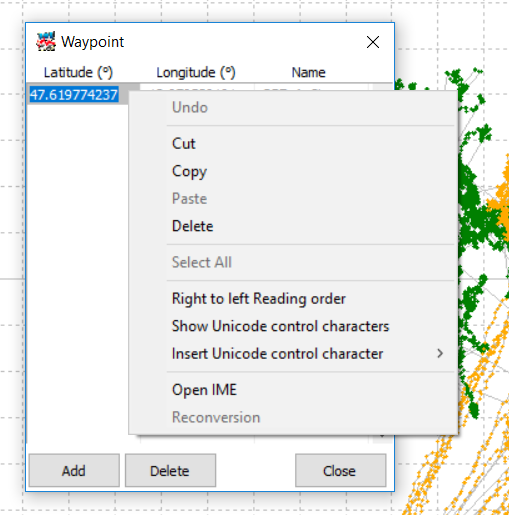
@TB_RTK, actually, it turns out that I can copy from the waypoint dialogue. Strangely, this only works with the right-mouse context menu and not with CTRL+C, but it’s what I was looking for!
Could you elaborate on how to sort out bad fixes? I only want average of Q=1 solutions but when I toggle the dropdown menu from ALL to Q=1, the orgin coordinate doesn’t seem to be changing only AVE, STD and RMS.
Use time span/intervel and select time period with least amount of spikes or if you can avoid them.
You can use position from the dropdown menu to find a good timeframe
There interval thing seems to only let you select 1 time period though? My position graph is green yellow green. Any way to cut out the middle part or am I stuck with selecting either the green in the beginning or end.
Dependig on the accuray you need.
1.You could drop a waypoint for the frirst green portion, and compare it to the second green portion with a new waypoint with the use of timeframe
2.Split the two green timeperiodes and postprocess the seperatly and then compare them.
3.Split them during postprocess and merge the “good” part with the use of *. in the path file
Using *. it fetch all files in that folder
Edit: There is also a section under output solution (rtkpost) where you can set max output std (m)
But i havent tried that one