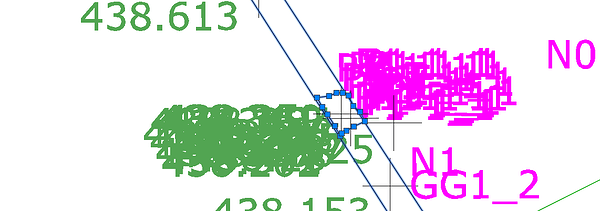
@inkar.madikyzy Hello and thank you! This is a visual example of what it looks like for us right now: all the heights and codes are cluttered together making it impossible to sort through them and this is just a polygon of 16 points.
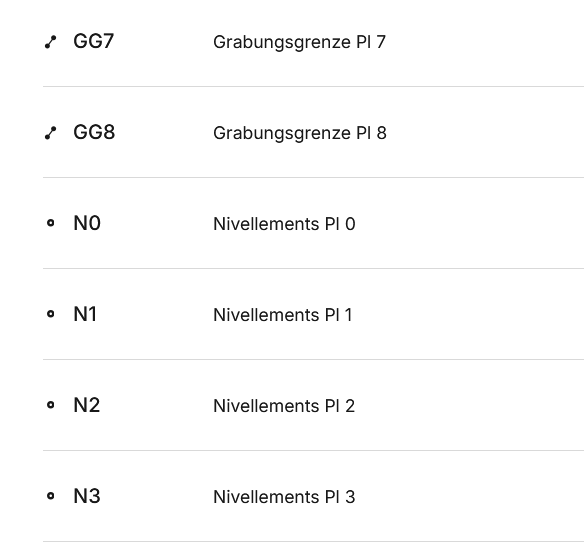
We work in Archaeology and we started using Emlid to measure our digs. We have been using Total Stations until recently, with a Third party software developed for our work, that had its own coding. The program is very good, but sadly it uses an outdated operating system which can no longer be sustained by us. We still use those codes as we are used to them, this is an example in Emlid:

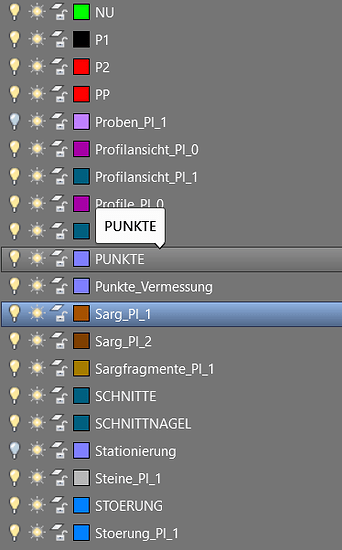
We had the code and a layer was created with the name of the Description attached to it:
.
We measure a lot of features - polygons (that means we don’t need the particular info plotted for every point), Heights - as points with height information, Profiles - simple A-B lines.
ah where I am going with this…
ah, yes, as
@tsmit439 is saying, having a code and the layer created with the name of the Description attached to it would be wonderful, that is what we all dearly need, more than anything.
Also, having all that additional info (the codes, descriptions, heights, point names) on a separate sub-layer is also a sweet idea. Having the option to check which one of these you actually want to be plotted is great, as we don’t always use/need them, so it would be great if that stays an option

(just putting this out there).
The longer I am writing about this, I realize how much more work it would take to actually make this a reality.
Thanks a lot, I hope all this text makes sense.


