Collecting GCPs By PPK Workflow

For others stumbling into this thread I too am in a similar situation currently. I have conducted a number of surveys now with our Emlid Reach RS+ units and am still establishing a practical workflow, site dependent. My first project was over a month ago and involved collecting GCPs to georeference a sUAS flight. I am just now getting around to PPK my solutions. I will describe what I have found in my journey as I have reached a similar position today.

I showed up to the site with two Emlid Reach RS+ in tow, one as my base and the other me rover. I first searched for a nearby NGS marker I found on the NGS website but no dice never found it. No way to establish an absolute base coordinate that day. Oh well I say, PPK it is. NTRIP was not an option yet although a nearby CORS site existed emitting corrections over the web. I was awaiting my login credentials and now have access but all my possible NTRIP correction sources are in NAD83 in the U.S., California for me. But that’s another story for another time. I am working on a “solution/workaround” here though as well but back to my field day.

I first setup my base station in an optimal location with wide open sky and immediately begin logging after dialing in my settings per documentation. Once satisfied, I begin averaging a proxy base location for 30 minutes IIRC. Once coordinates were collected for base I saved manually. Looking back I should have written this number down, its good to have, but can be dug up later as well. Once base was established I fired up my rover and matched settings to that of the base and set my LoRa connection between the two. LoRa did great, had fix most of the day even running between tall pines and dense thickets of willow. I collected my GCPs, twelve in total, and exported my survey project out of the Reach app. Yay, now I’m done but I have at least a meter of error in all my points (absolute). So here I am sitting at my workstation needing to correct my controls to drop into my photogrammetry software.

I download all necessary files from the closest CORS station to my project site to process in RTKPost. As I said earlier the CORS site here is referenced to NAD83 but I need WGS 84 for my reach logs. I find the coordinate of the base station in the provided .coord file. I then use this tool from NGS/NOAA that has already been posted quite extensively on this site to convert from NAD83 into WGS84 also taking into account the movement of the plates.
NGS/NOAA - HDTP
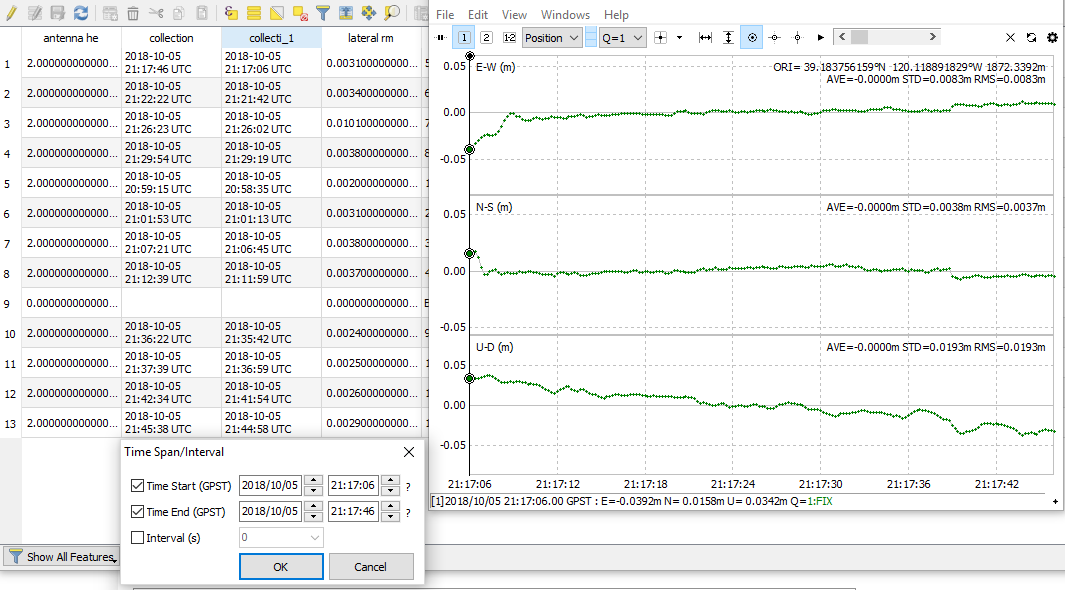
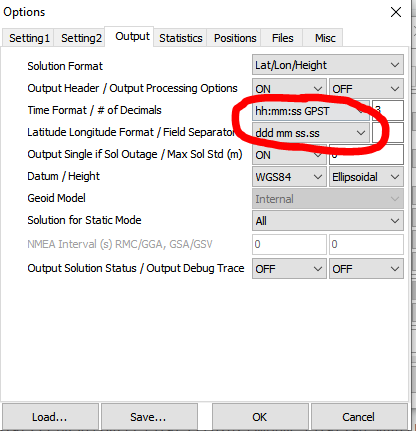
I then use my newly transformed coordinate in RTKPost options for manually entering the base station location for my chosen CORS site. Pay attention to positive and negative values (lets say I accidentally dropped a negative sign and couldn’t figure out why my solutions were all Q=5…). Anyway, fixed that and ran my Reach Base logs as rover to the CORS site I chose as base. Got quality fix Q=1 and then filtered by time interval only my Q=1 solutions. Then used statistics in RTKPost to extract an average of my desired points and alas, new base coordinate for my Reach unit! I took this coordinate and plotted in GIS.

My original thought was this, if I knew my “original” base location collected from my 30 minute average and I then had a “corrected” base position derived from PPK could I not apply a uniform shift to all my surveyed rover points by the same magnitude of the difference between “original” and “corrected” position in GIS? Intuitively, this makes sense to me because its all relative (base and rover) but my first run did not seem to match when compared to my corrected Rover positons. I am still working through this technique because I am not convinced I can’t do it this way and would in fact potentially by applicable to my NAD83 NTRIP issue as well…

I then took my raw rover logs into RTKPost and corrected to my Emlid Base logs with the new PPK derived coordinate and ran it. I achieved good results here just as the base did. So here is where I am at currently, after I PPK both base and rover logs I convert in RTKPost their respective position file into a GPX track that drops right into GIS software. QGIS drops right in but have to import in ArcMap.

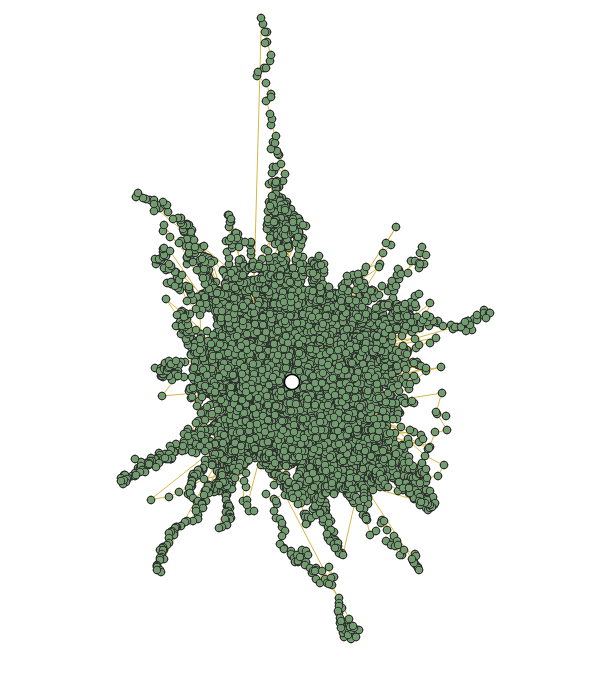
With GPX in GIS I was able to use some tools I am familiar. This is what my base GPX track looks like in GIS with the average plotted (white dot).

This is what my rover track then looks like in GIS.

From the rover track I was able to focus on the areas where I had longer occupation time (my GCPs). I filtered and queried only the positions I was concerned with for my GCP. I could tell where a longer occupation time occurred due to “clustering” of points. I simply selected out the points of interest out of the rover track into a new individual file per GCP. I have not done this yet but my plan was to run statistics to arrive at an average coordinate and then plot.

Well, I can say this wasn’t terrible but it definitely wasn’t as automated as I would like. If you have lots of points you are going to have lots of fun without scripting this task somehow. However, I still think the best solution would be to apply a transformation to the original base coordinate from PPK solution and take your rover points and apply the exact same transformation. But when I tried this at first after applying a shift my points didn’t land on the corrected rover cluster. Does this workflow seem reasonable? Where could I have introduced error in terms of a transformation? As I said before I did not write down the average base coordinate. I thought I found it in the Rinex header of my position file when ran RTKPost on Reach Rover and Reach Base prior to inputting corrected base coordinate…

EDIT: This is the tool and workflow I will be using in QGIS
Averaging Points in QGIS

2 Likes

Just wanted to let you know that I cross-posted you to the DroneDeploy Forum. Keyword EMLID GPS. (drone relevant)

Nice write-up!
Any reason why you didn’t use RTKplot for the extract of the Rover GCP’s ?
From your survey you already had start/stop timestamp, so no special need for visual inspection. That takes quite a bit of time (take from someone that didn’t initially log the timestamps, and had to visially inspect the track to get start/stops :S )

In this particular instance, no, I just was in GIS mode at the time. I’m a GIS analyst by trade and went with what I knew. Still getting totally comfortable with RTKPost but its fairly straightforward to me now. Playing with the time stamps functionality in RTKPost for extraction and got me thinking some more. Going to try a couple other techniques today on the same dataset in an attempt to more automate this task. Hopefully will have something of substance to report shortly.

In the image below we can better see what wizprod is referring to. Screen to the left is the attribute table for the survey project shapefile right out of the Reachview App in QGIS. Notice the two collection columns denoting start and end time. Below the attributes is the dialogue box in RTKPlot to select by Time Span/Interval. In this case I used my first point and populated the dialogue box accordingly. To the right is the position plot in RTKPlot after selecting my time span/interval of interest. See statistics in upper right and particularly the ORI. We now have a coordinate for my first GCP.

This wasn’t too bad but sometimes I’m lazy and don’t want to manually type out coordinates. I haven’t found a good way to plot the ORI as waypoint in RTKPlot either. Not terrible for a few points but if you have a large number you may not like this method, not to mention the introduction of human error with a mistype. Me thinks a good method is buried in GIS somewhere just waiting for me.

1 Like

Thanks, was very active with DroneDeploy in its infancy. I use Pix4D exclusively now. All are doing great things for the sUAS industry.

Exactly what I mean yeah… But the workflow leaves much to desired…

Yes, leaves much to be desired but most importantly it works.

For those wanting to do this in GIS. Be sure to export your GPX file with time attribute field (UTC). Then do whatever you want with it with the vast array of tools available in QGIS. I personally filtered by desired time interval and ran mean coordinates on the selection. The aggregate tool in QGIS caught my eye but need more time with it. Hope this helps some folks, happy surveying.

Attribute table with time stamps in QGIS (left) and GPX export options box with output time marked (right)

I agree 100% that an automated post-processing method to extract GCP’s from these logs would be worthwhile. The CSV states the start and stop times from collection, so the data is already available.

Unfortunately, starting and ending the solution so quickly doesn’t result in an immediate fix. Sometimes I have to correct the entire path (PPK) and then extract the useful points AFTER that is complete.

Another solution to find or average the correct positions is to extract them from the .pos file after processing. It really helps to have it formatted to match the time and format that you are looking for. image

1 Like

This makes me think of another thread that was going on and I asked the question of why couldn’t we get events like the drones do. If you have the full GPS track PPK’d and know the timestamp of the closing of the point capture then it seems it would be fairly easy for the program to create the like events POS? That’s how noob I am. :slight_smile:

Well technically a single event is one way to do collection, however events are inherently an interpolation of just 2 observations. I would rather rely on the averages of a few hundred instead of just 2. You bring up an interesting thought though. Instead of a start-stop, we could use a single mid-point event per observation and then move forwards and backwards a certain number of observations to find a good average.

1 Like

Exactly. User jurijs.jeshkins has begun what looks to be a promising solution. You can pull a copy of the program from the thread below. I will be running a sample dataset through it later today. As a matter of practice I typically occupy a point for a minimum of 1 minute and most often two minutes regardless of status. More information the better for PPK.

As he also correctly points out in the thread and as you bring up ensure your output file is in the same time format. In my post above it shows output as UTC when it should be GPST as you have shown in red circle.

If inclined to do so in QGIS, one could use the aggregate function based on point time stamps, start and end times, to batch the entire track log into “groups” containing a few hundred observations depending on logging frequency. I am slightly confused on what you mean by midpoint or just two observations. Your corrected log file should have more than two points to interpolate from, unless you occupied the point for 1 second.

1 Like

When we use the M+ units for camera shutter logging, an event file is created with only the positions where the pictures were taken. That _events.pos file file is VERY handy, and generating it is completely automated. Those events, however, are only interpolated from the previous and next GPS observation in the file, and are not an average of many points. Normally this log is very kinematic by nature.

My point is that this shutter logging/event mark functionality already exists in the air and could be exploited for use on the ground. Instead of interpolating between GPS observations, a number of neighboring observations could be averaged around the event (button push) OR start/stop times could be integrated through another file or another means.

1 Like

This topic was automatically closed 100 days after the last reply. New replies are no longer allowed.