


Hi all. I have (with your help) sorted the other issues that I have had and I want to thank you for that, but again I need your help. when I process the data and use RTKplot to plot the results the RMS is very high and I am not sure why. Iam using a RS+ as my base and RS as my rover. I’m not using a known point for my base or a correction service. Could someone point me in the direction of how to improve the data collection, processing and so the RMS. thank you.
Hi @sgeyeuk,
May I ask you to post your files so that we can check them? It’d be great to see raw data logs and the result of the post-processing. Then it’ll be possible to understand what might cause the high RMS values.
Sure do you want the CSV and the base znd rover logs?
Yep… including the .ubx
Hi again. These ar the raw data from the rover raw_202005271306.nav (39.4 KB) Uploading: raw_202005271306.obs… raw_202005271306_ubx.zip (6.1 MB) base_202005271306_RTCM3.zip (375.3 KB) raw_202005271306_RINEX-3_03.zip (5.4 MB) solution_202005271306_LLH.zip (193.6 KB)
HiThese are the raw data sets from the base. base_202005271226_RTCM3.zip (146 Bytes) raw_202005271226_RINEX-3_03.zip (2.6 MB) raw_202005271226_ubx.zip (3.5 MB) solution_202005271226_ERB.zip (385.4 KB)
These are the Pos files and the original CSV from the reach view app as well as the CORS data and the base location generated from the files using RTKLib. RH-06-03-05-20.zip (1.5 MB)
Have you had any luck pal. It driving me mad.
Hi @sgeyeuk,
Sorry for the delayed response!
I’ve checked your files. According to the recorded CSV file, RMS of each point during the survey is around 1-2 cm which is appropriate for the points collected in Fix solution.
When you open the solution file in RTKPlot, the RMS that is shown in the Position tab is calculated relatively to an averaged position. It means that for the trajectory, RTKPlot will show the big value as each point’s coordinate may be drastically different from the averaged position of the receiver.
To check the RMS of the point you collected, you need to set the time of the point collection in the RTKPlot. To do that, go to Edit -> Time Span/Interval and set the start and the end time of the desired point collection. You can check the collection time in the CSV file.

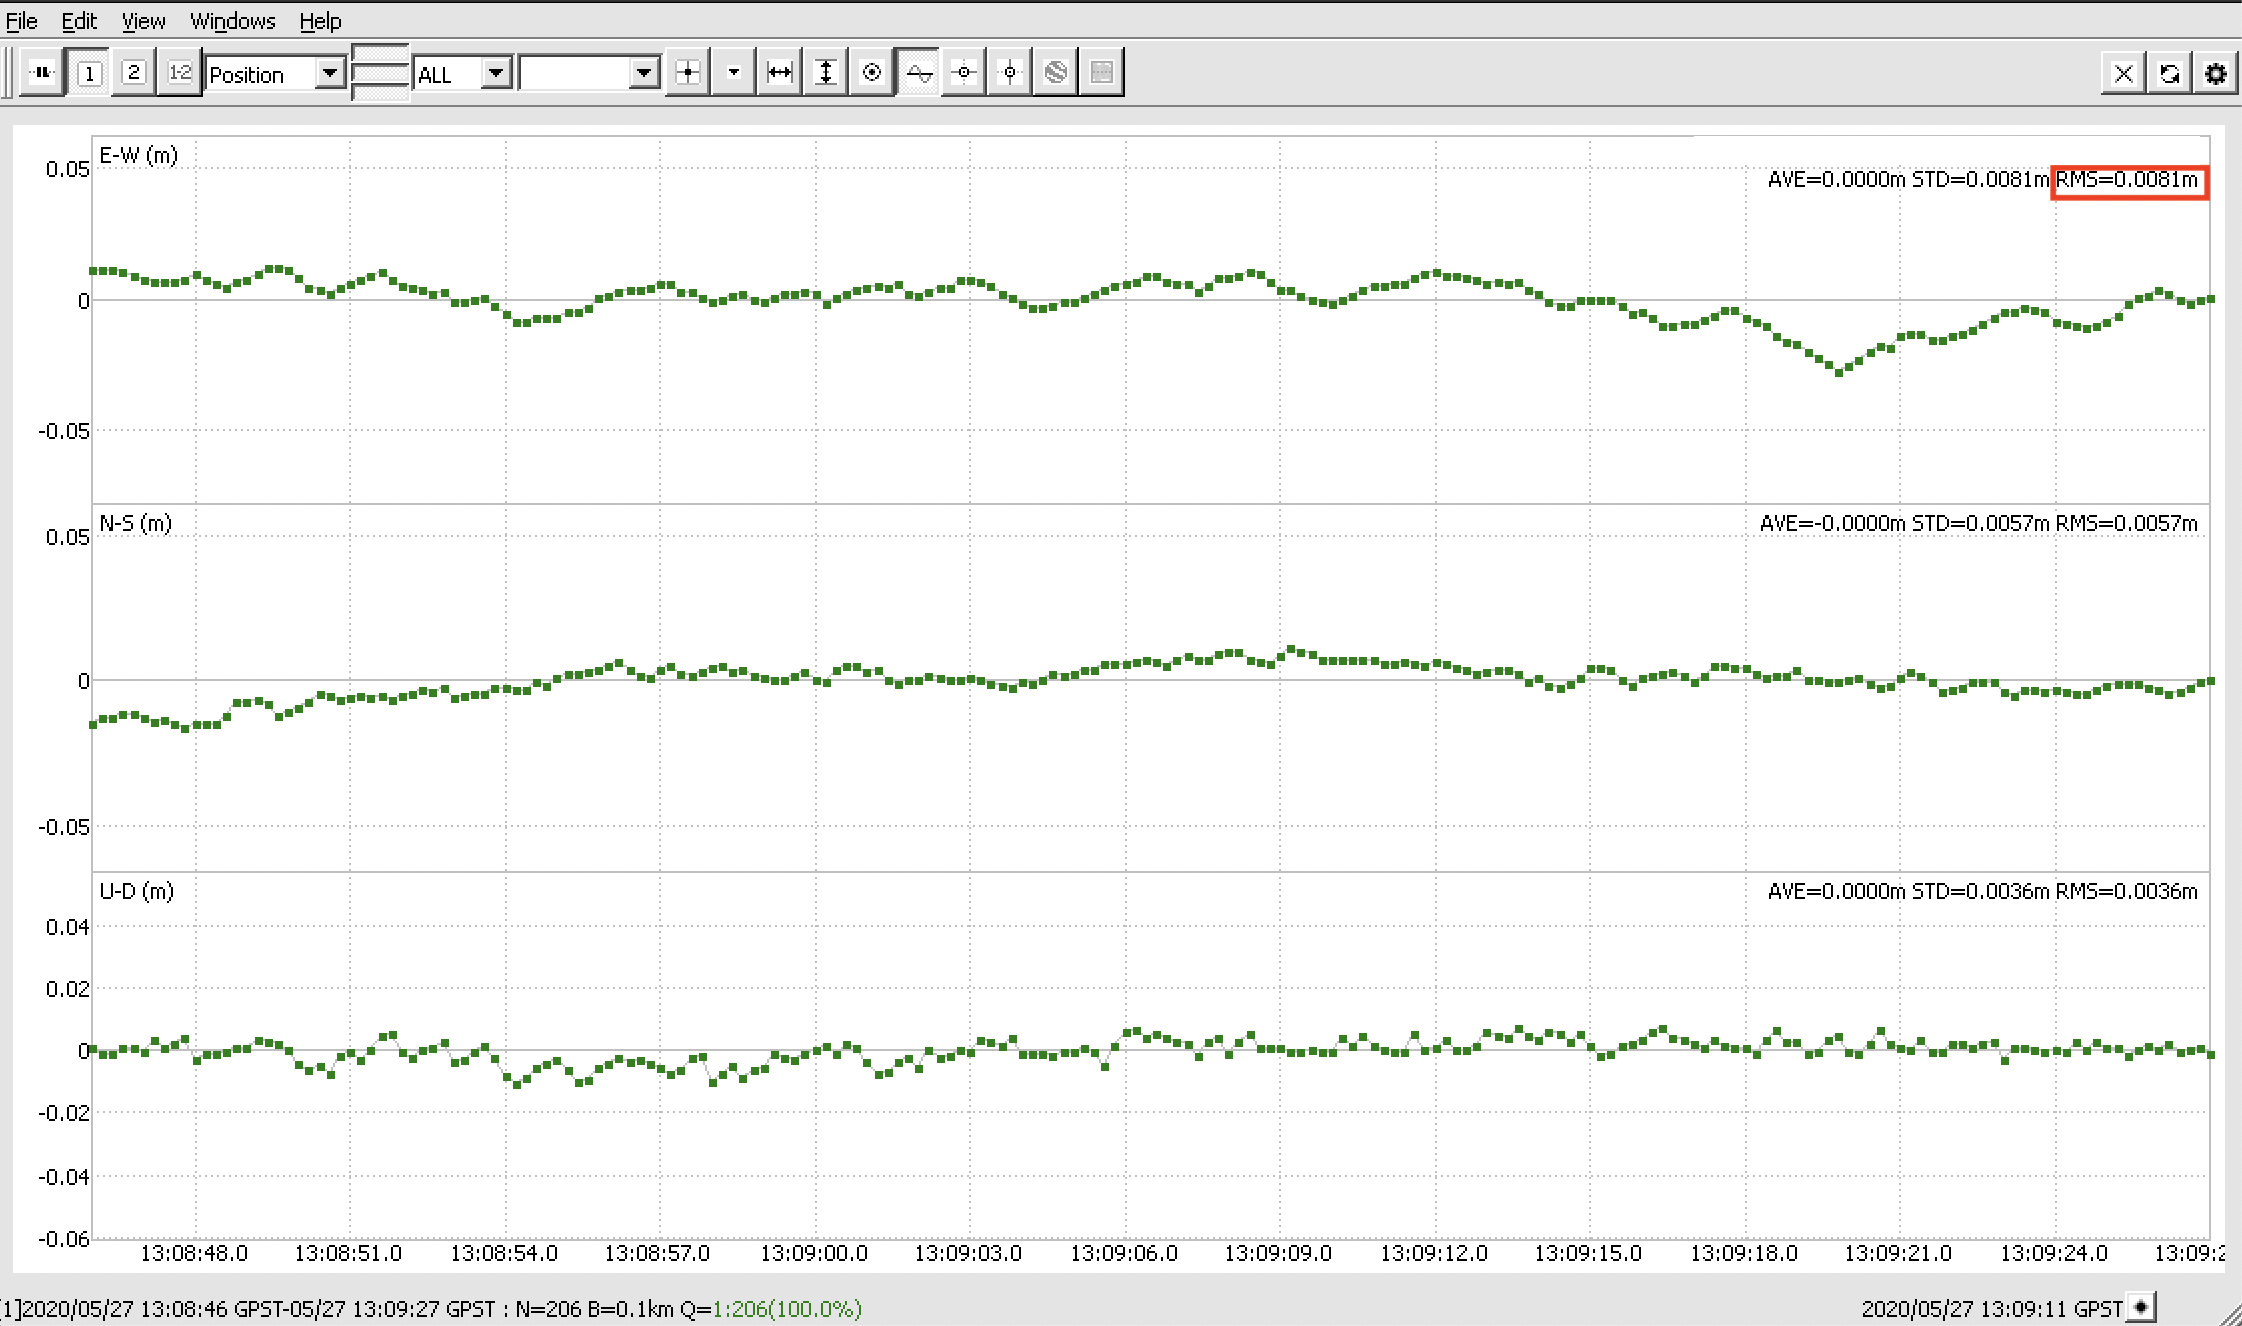
For example, I’ve checked the collection of your first point. Its RMS shown in the RTKPlot is 0.81 cm. I’ve attached the screenshot.
2 Likes
Hi. Thank you for this. I did use the time span interval but got a reading of 2.8 mtrs. What settings did you use in RTKLib?
Hi @sgeyeuk,
I post-processed your data with the default settings of the RTKPost described in this guide.
Please pay attention to the fact that in the CSV file, the times of the collection start and end are recorded in UTC. In RTKPlot, you need to specify the time in GPST. GPS time is 18 seconds ahead of UTC.
Thank but to be clear if the collection start time was 10.00.00 (10am) then I need to put in 10.18.00
Hi @sgeyeuk,
You’re correct.
As it’s possible to get from the CSV file you posted, your first point was collected from 13:08:28 UTC to 13:09:09 UTC. To check the position of this exact point in RTKPlot, you need to specify the start time as 13:08:46 GPST and the end time as 13:09:27 GPST. You can see that it’s how I checked the RMS of the first point shown on the screenshot above.
Thank you
1 Like
This topic was automatically closed 100 days after the last reply. New replies are no longer allowed.