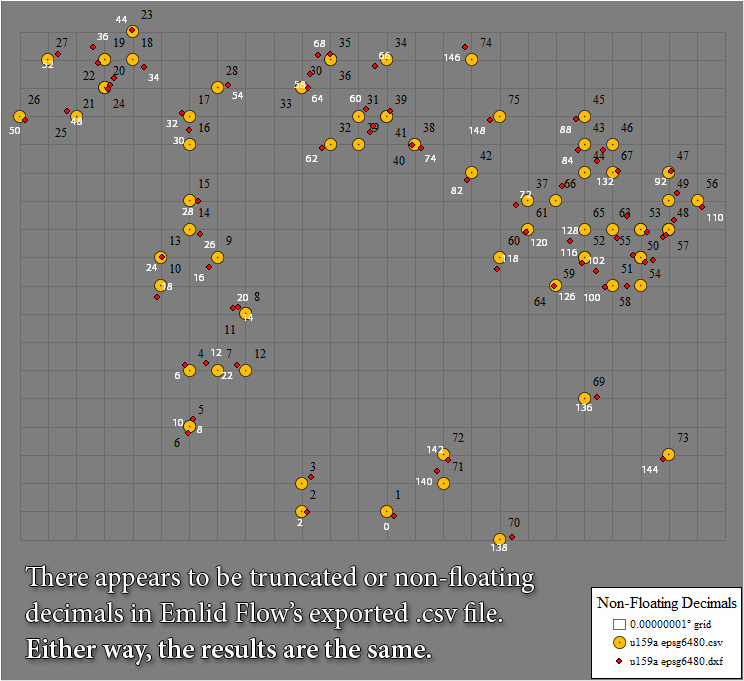
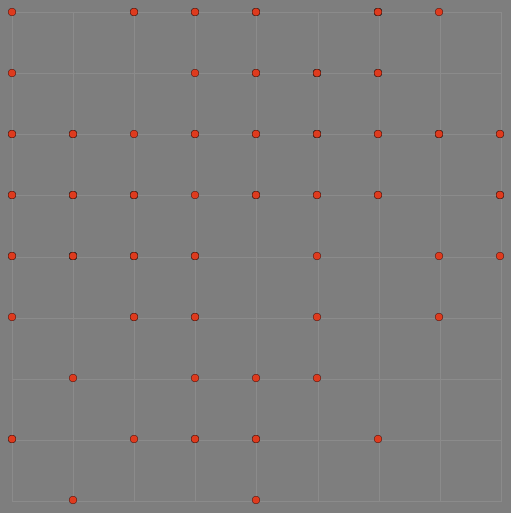
Exported Survey (free version) in .csv file format results in what I referred to in an email sent earlier to Emlid support as a Go Board, seen above with orange tokens. The exact same dataset exported as a .dxf are seen here with smaller red dots which appear to be full floating decimal values.
If the above comparison to Go has you curious, below is a real Go game board:
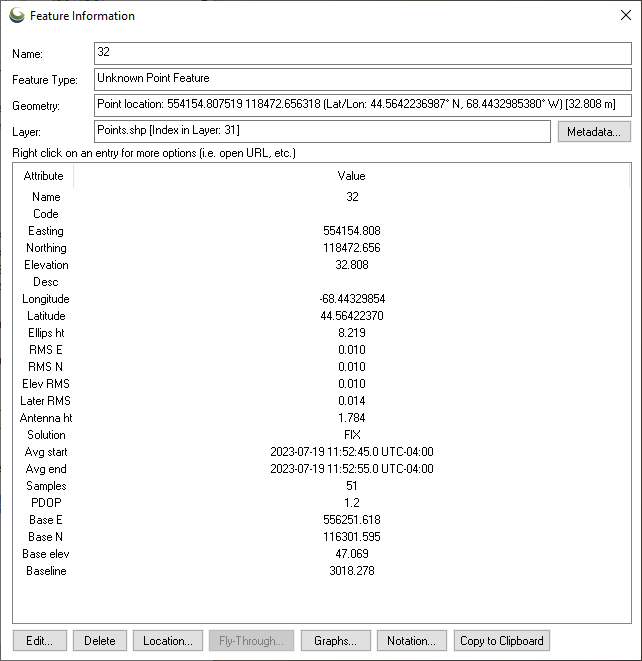
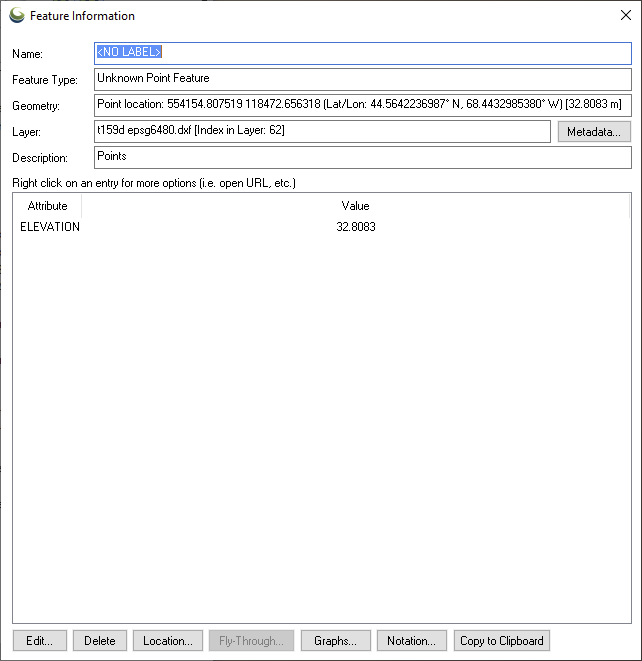
The preferred workaround to this issue of non-floating decimal or truncated coordinates in the .csv files produced by Emlid Flow is to use the export option Shapefile. Shapefile exports preserves the attributes, whereas the .dxf option strips away most attributes:
Yes, the coordinates from the DXF file are not rounded. So they have more decimals than the coordinates from the CSV. But why do you need those decimals? Is it for a specific application?
In general, double-precision floating-point formatting provides the best resolution, widest dynamic range and most accurate numeric representation of a thing in sight, sound, or space.
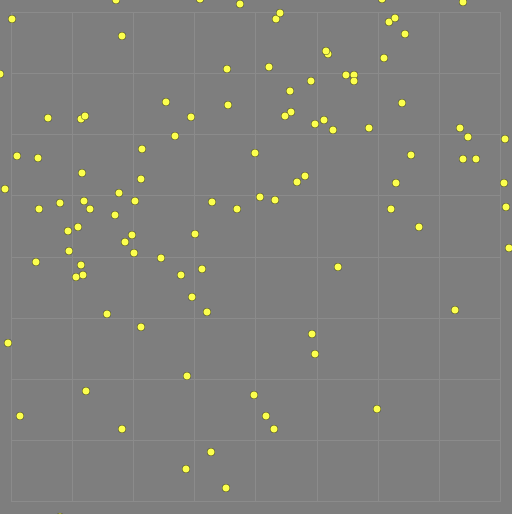
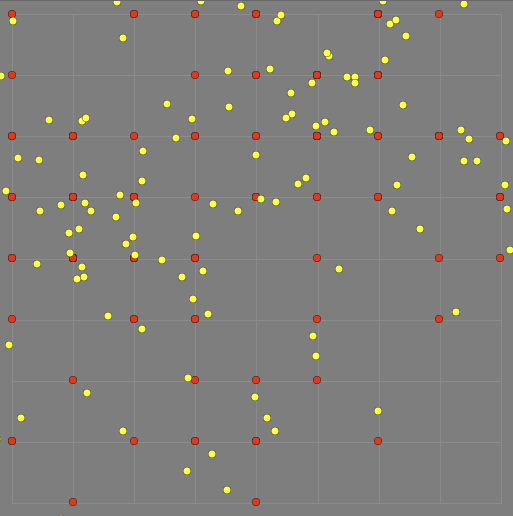
For example, which image below has the most number of points?
A
B
The answer is neither A nor B; both images have exactly the same number of points!
And in case you were wondering, these RTK points were collected using the RX on a magnail in the curb at Ellsworth City Harbor Park on 20230629 at ~0700 UTC-4
As far as I know, you’ve also discussed this question with my colleague Kirill via email. However, I just wanted to say that having more decimals in the DXF file for the points doesn’t make the data more or less accurate. The accuracy of the receiver is still at the centimeter level. So the coordinates to millimeters from the CSV should be enough.