Hi.
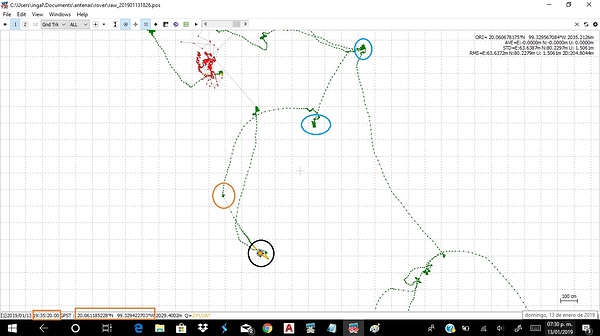
Today I wanted to do a small test with three points and when downloading the csv file. the last gcp does not match the rtkplot time. In the image the circle in black shows where the marker is and the time is at 19:35 …, when in fact my gcp is at approximately 19:34 … red circle.
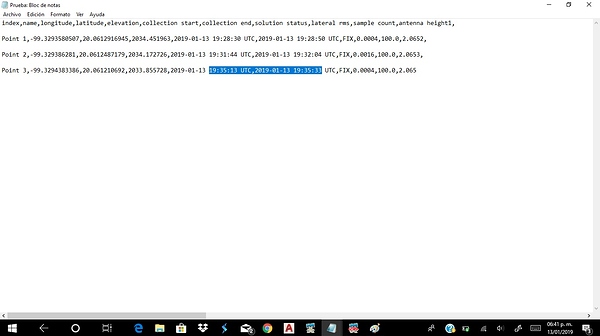
In the image of the csv file you can see the start and end of the collection in blue.
You can even see that the coordinates do not match anything, rtkplot shows 20.061185228, -99.329422703 and in the csv file: 20.061210692, -99.3294383386.
Another thing that leaves me in doubt is because the time I did the survey does not match the time it shows reachview and downloaded files. I did my survey at approximately 12 noon, time from the center of Mexico and in the downloads and reachview show 17:00 … hours


