If anyone has the time to look at this case I would be very grateful.
I was conducting a survey in the back and beyond, plenty of clear sky view. It was a hydrographic survey so the receiver was mounted on a moving vessel. The base, firmly secured on top of a building on land – clear sky view. I’m running a pair of Reach RS units - should be all up to date.
I have tried post processing so many times with a plethora of settings in RTKPOST. I get fixes >95% in most scenarios but the vertical positions just do not add up to what happened in reality – that is the attitude of the boat. The vertical positions I get vary by a meter or more, (squat on the boat would not be this much) around an order of magnitude greater than what would be expected. Change in vertical positions over the course of the survey seem coincident with the heading of the vessel, so we kind of end up with these parabolic curves in vertical position for each transect………………honestly I am out of ideas.
The boat was moving a lot – it was a choppy day, and the survey pole mounted on the vessel had a bit of wobble. I have increased the Max Accel values for these reasons but it hasn’t helped. I also spent a bit of time creating of list of sats to exclude………mixed results but none of them useful so far!
I have taken the liberty of providing a link to the obs/nav files I have stored on Dropbox. There is a text file with the base location as well. Dropbox - File Deleted
If you are inclined to have a look that would be great; I’m just hoping there is something simple I am missing.
I would try processing one of the ‘humps’ by itself. Maybe 6:40 to 7:06. See if it comes out more level.
It looks like there was ~0.5m of chop
What size was the vessel? What kind of body of water was it on?
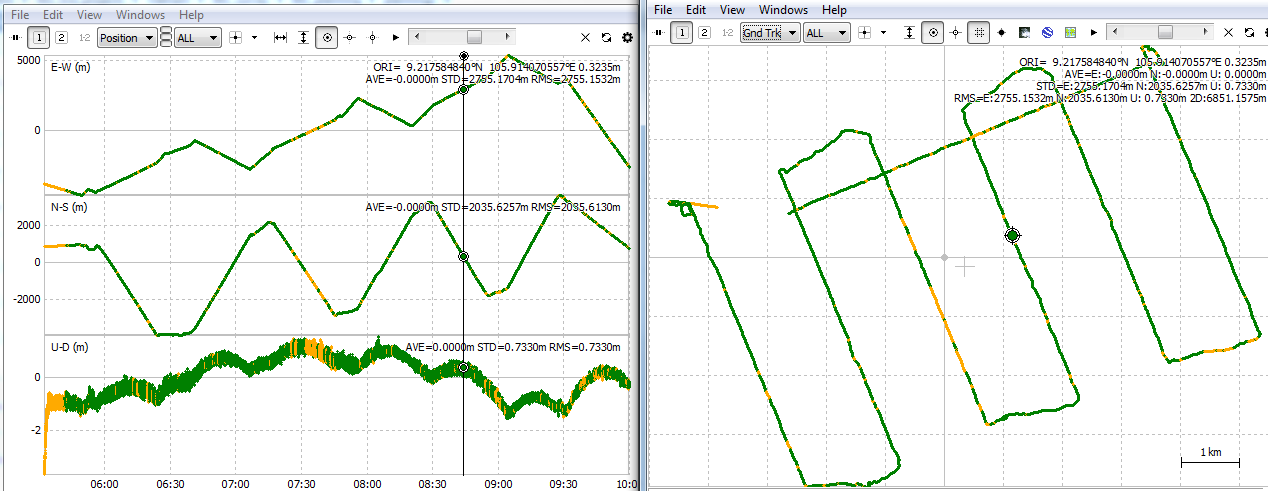
It would be interesting to see the ground track and altitude correlation. i.e. are the heighest altitudes recorded toward the center of the body of water, or at the places of greatest depth
Hi bide,
Yeah I have run the humps (first off to reduce processing time). No noticeable difference.
Yep, 0.5 m of chop, may be a little less. The vessel was quite small, ~7 m. It was on the open coast, and the seabed is basically flat as a pancake (1:1000). I believe these bumps are pure artifact created by rtkpost. Could be wrong…
Anyone else? Like I said, I have run many many different PPK scenarios. They all have the humpty hump.
Cheers
Hmmm. Well tide should have a longer period, but it could be some related harmonics or something crazy like that. But on the open coast and flat bottom it just seems unlikely.
If there’s chop, then there’s wind. Maybe some kind of wind effect?
The proper thing to do is what the world record land speed record holders do: run the race course both ways (forwards and backwards). So run the same line forwards and backwards.
Also if you are doing bathymetric survey and have a flat bottom, you should notice the same pattern in your soundings if the RTKPost altitudes are real and it is some kind of water effect. If RTKPost lies and is misrepresenting the altitude, then there should be no evidence of this pattern in your soundings.
I like your thinking, and thanks for your input TB, but I do not believe it is any of the above. Although the long term trend/curve is the tide.
I have a good handle of coastal processes. I did think that maybe there were some longer period processes at play first of all, but looking at the position data, even in the image above, you can see a correlation between the headings and the bumps and this is all completely irrespective of depths (they will be post possessed as well). Another image below shows the peak of the bumps occurring mid transect. Its like either the receiver (raw data) gets spun out during the turns, or rtkpost doesn’t like something. Turn were not sharp, on the contrary it was a very slow and long survey.
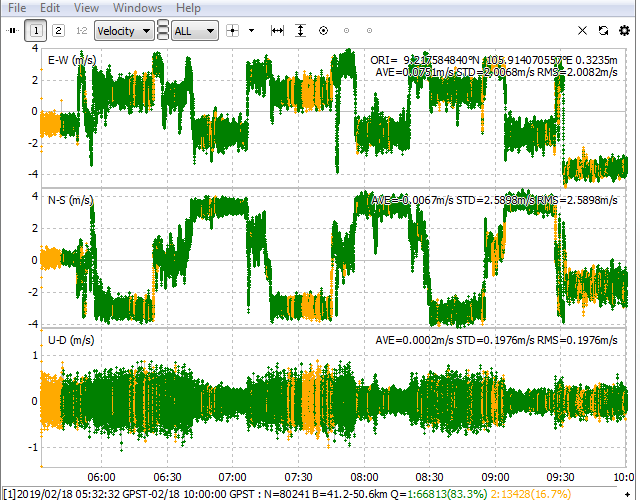
Have you got a chart that plots the boats velocity? and a photo of the overall setup?
Depending on where on the vessel you had the pole, as the boat goes faster, the vessel could have tilted, and as it slows down it would have returned to a more neutral level/flat.
Another great bit of input. You are right that the vessel would squat under more power but not on these time scales nor on these magnitudes. If this were the case the vessel would be squatting nearly 2 m - i would be very wet, and it would occur over the length of a transect, >5 km. Vessel attitude is certainly expected though.
Yeah. I was already thinking that I should clarify my remark about tide. At first I was focused on the little bumps, so it is nice to know that the large bump from 05:50 to 09:05 is tide.
The receiver is just listening to the satellite transmission. The fact that you processed the humps separately should have eliminated that possibility.
So you were doing like 20+ knots then? The hull must have some lifting properties even if it doesn’t plane, no? Then the chart would probably be more of a square wave than sinusoidal if it was to do with the hull lift (or squat).
As @ashley.walker said, a look at the velocity chart would be nice…
My cheeky response would be that you just need to buy one more Reach device and either get @TB_RTK to send you one of his floating ardubuddy prototypes, or make some floating RS holder like that. In either case it should be floating off of an anchor.
That way you can have a relative ocean altitude vs your boat altitude.
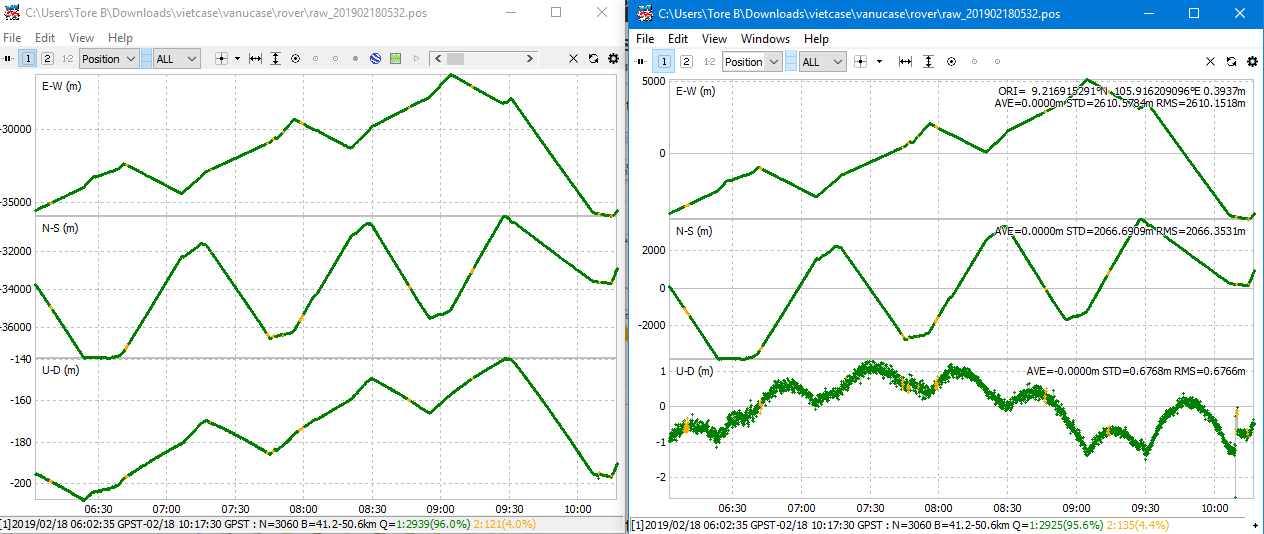
Yeh no, it`s not so much a tide issue. More like a RTKlib Emlid vs RTKlib 2.4.2 and some local boat differences.
RTKlib 2.4.2 to the left, Emlid version to the right.
Something “fishy” is going on for sure.
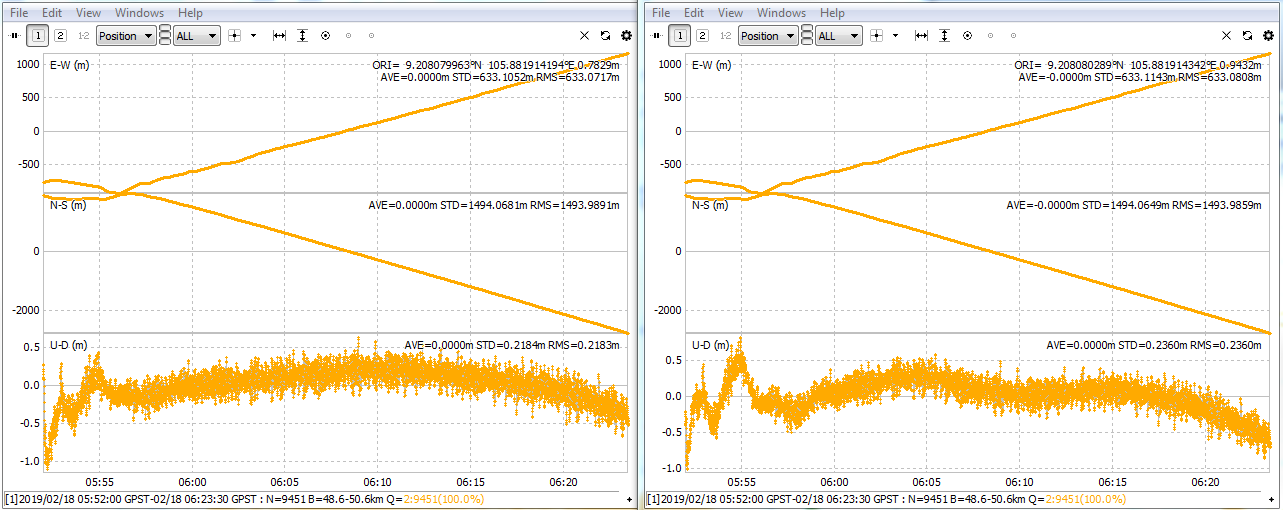
Will be checking the depths later to see if it is something to do with the attitude of the vessel, but i just processed and fixed 3 individual transects, 90% fixes, 2 different heading/directions and the curve is still there (no turn data included). I am a stunned mullet.


 is going on for sure.