Hi,
I’m using two reach RS2 systems in a base/rover setup.
The rover is mounted on an AGV (which is the device under test). This AGV is driving around on a test track and I want to be able to verify its own internal localization system and to see if changes in the machine or in the software have a positive effect on the navigation quality of the machine.
So ideally I want to compare the external data of the Reach with the internal data of the machine.
The AGV drives multiple rounds around the test track to get an idea of the navigation quality of the machine (to get the bandwith in which the machine navigates).
The result ideally would show that all the points during the different routes overlap.
Since not only the AGV will deviate but also the accuracy of the RS2 I was looking into the standard deviation (sdn, sde, sdu, sdne, sdeu, sdun). But I’m not so sure how to interpreted this data.
I have been reading the RTKLIB documentation and some different posts on this forum regarding the covariance matrix but it still doesn’t make sense to me.
The documentation states that those are: 'The estimated standard deviations of the solution assuming a priori error model and error parameters by the positioning options.’
But if it is the standard deviation of the model used why are the values different for the different samples even though the amount of satellites and the quality is the same?
In another post (Columns 10-12 of Kinematic Processing Output) it is stated that these numbers are the standard deviations of the latitude, longitude and the altitude. Is this the correct way of thinking about it? So if I have a record for the lat, long and height and the standard deviation for those variables I can say with 68% certainty that the position of the AGV is on that particular point the latitude entry +/- 1*sdn for instance?
Next to that, I don’t really get how the covariance matrix fit in with all of this. In my understanding when you calculate the covariance matrix you can see how the different variables are related to one another. But in this context I don’t really see the value in calculating how the different coordinates relate to one another. I’m probably missing something since I never used the covariance matrix.
Any help is much appreciated!
Hi @tdejonge,
Sorry, it’s been so quiet here.
But if it is the standard deviation of the model used why are the values different for the different samples even though the amount of satellites and the quality is the same?
Every time Reach receives new information from satellites, it recalculates its position. This information includes pseudorange, career phase, change of frequency due to the Doppler effect, and SNR. So, this information will be new with each epoch.
So if I have a record for the lat, long and height and the standard deviation for those variables I can say with 68% certainty that the position of the AGV is on that particular point the latitude entry +/- 1*sdn for instance?
Overall, 1 standard deviation corresponds to 68% certainty. But to get the highest possible accuracy in Emlid Studio, we’d recommend checking that there’s a Fix solution in the first place. The Fix solution in the Emlid Studio is considered if the AR ratio is more than 3. AR ratio is the ratio of the sum of the squared residuals of the second-best Fix solution to the sum of the squared residuals of the best Fix solution.
Next to that, I don’t really get how the covariance matrix fit in with all of this. In my understanding when you calculate the covariance matrix you can see how the different variables are related to one another.
If the base position is accurate and there’s a Fix solution for all the points, you’ll get accurate results too. The covariance matrix is usually used to generalize the notion of variance to multiple dimensions.
1 Like
Hi @olesia.riman,
Thank you for your response!
I indeed only use the data whenever there is a Fix solution.
Now it makes sense that there is a small deviation in the standard deviation, there is more to it than is displayed in the logs.
Another way I’m planning to get to the accuracy / standard deviation of the results is leaving the rover stationary for a prolonged period of time to collect data and measure the diameter of the resulting cloud of datapoints.
Thank you for sharing!
Let us know how your project goes, it’s quite interesting.
Hello,
I have been trying to determine the accuracy of the system and besides that I tried to get an accurate position of the base, which will be located on a fixed point on our test track. With the idea to determine the position of the base one time and use these coordinates to post-process all the data which I will get over time. With this approach I should be able to compare logs from different days with each other.
The approach I took was the following:
Let the base gather data for 30 minutes, write down those coordinates.
The following day I positioned the Rover on a tripod to deteremine the accuracy of the system, which I was talking about in the previous post.
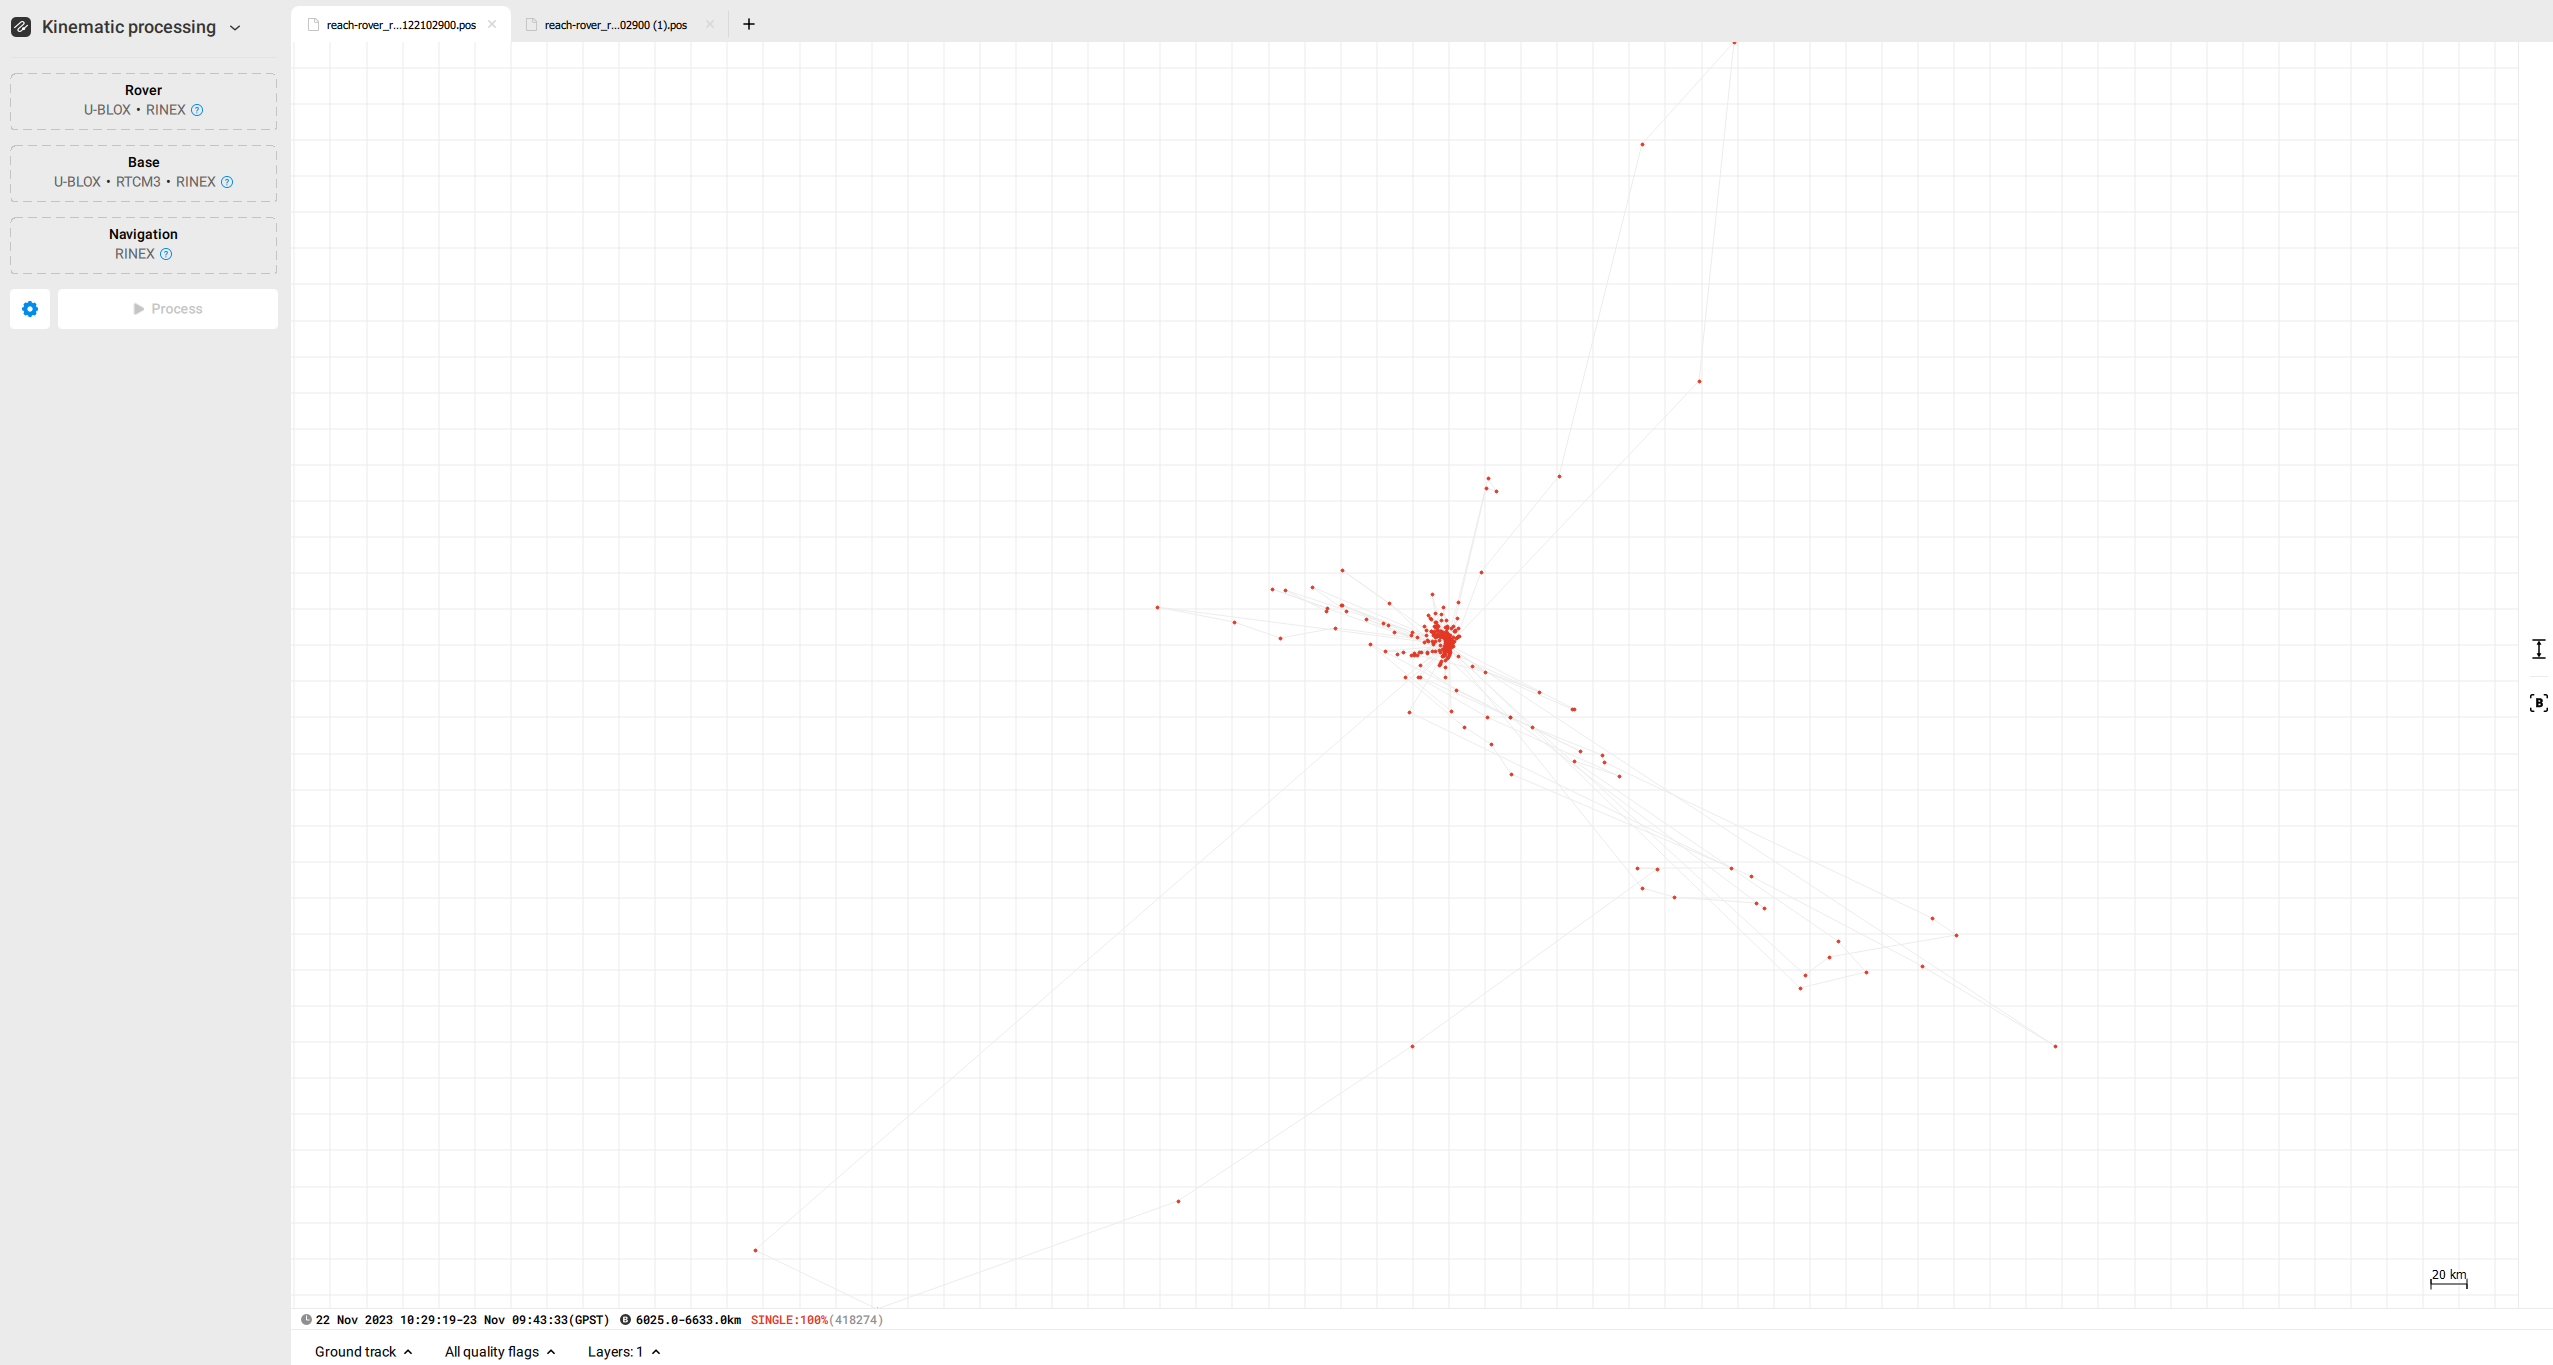
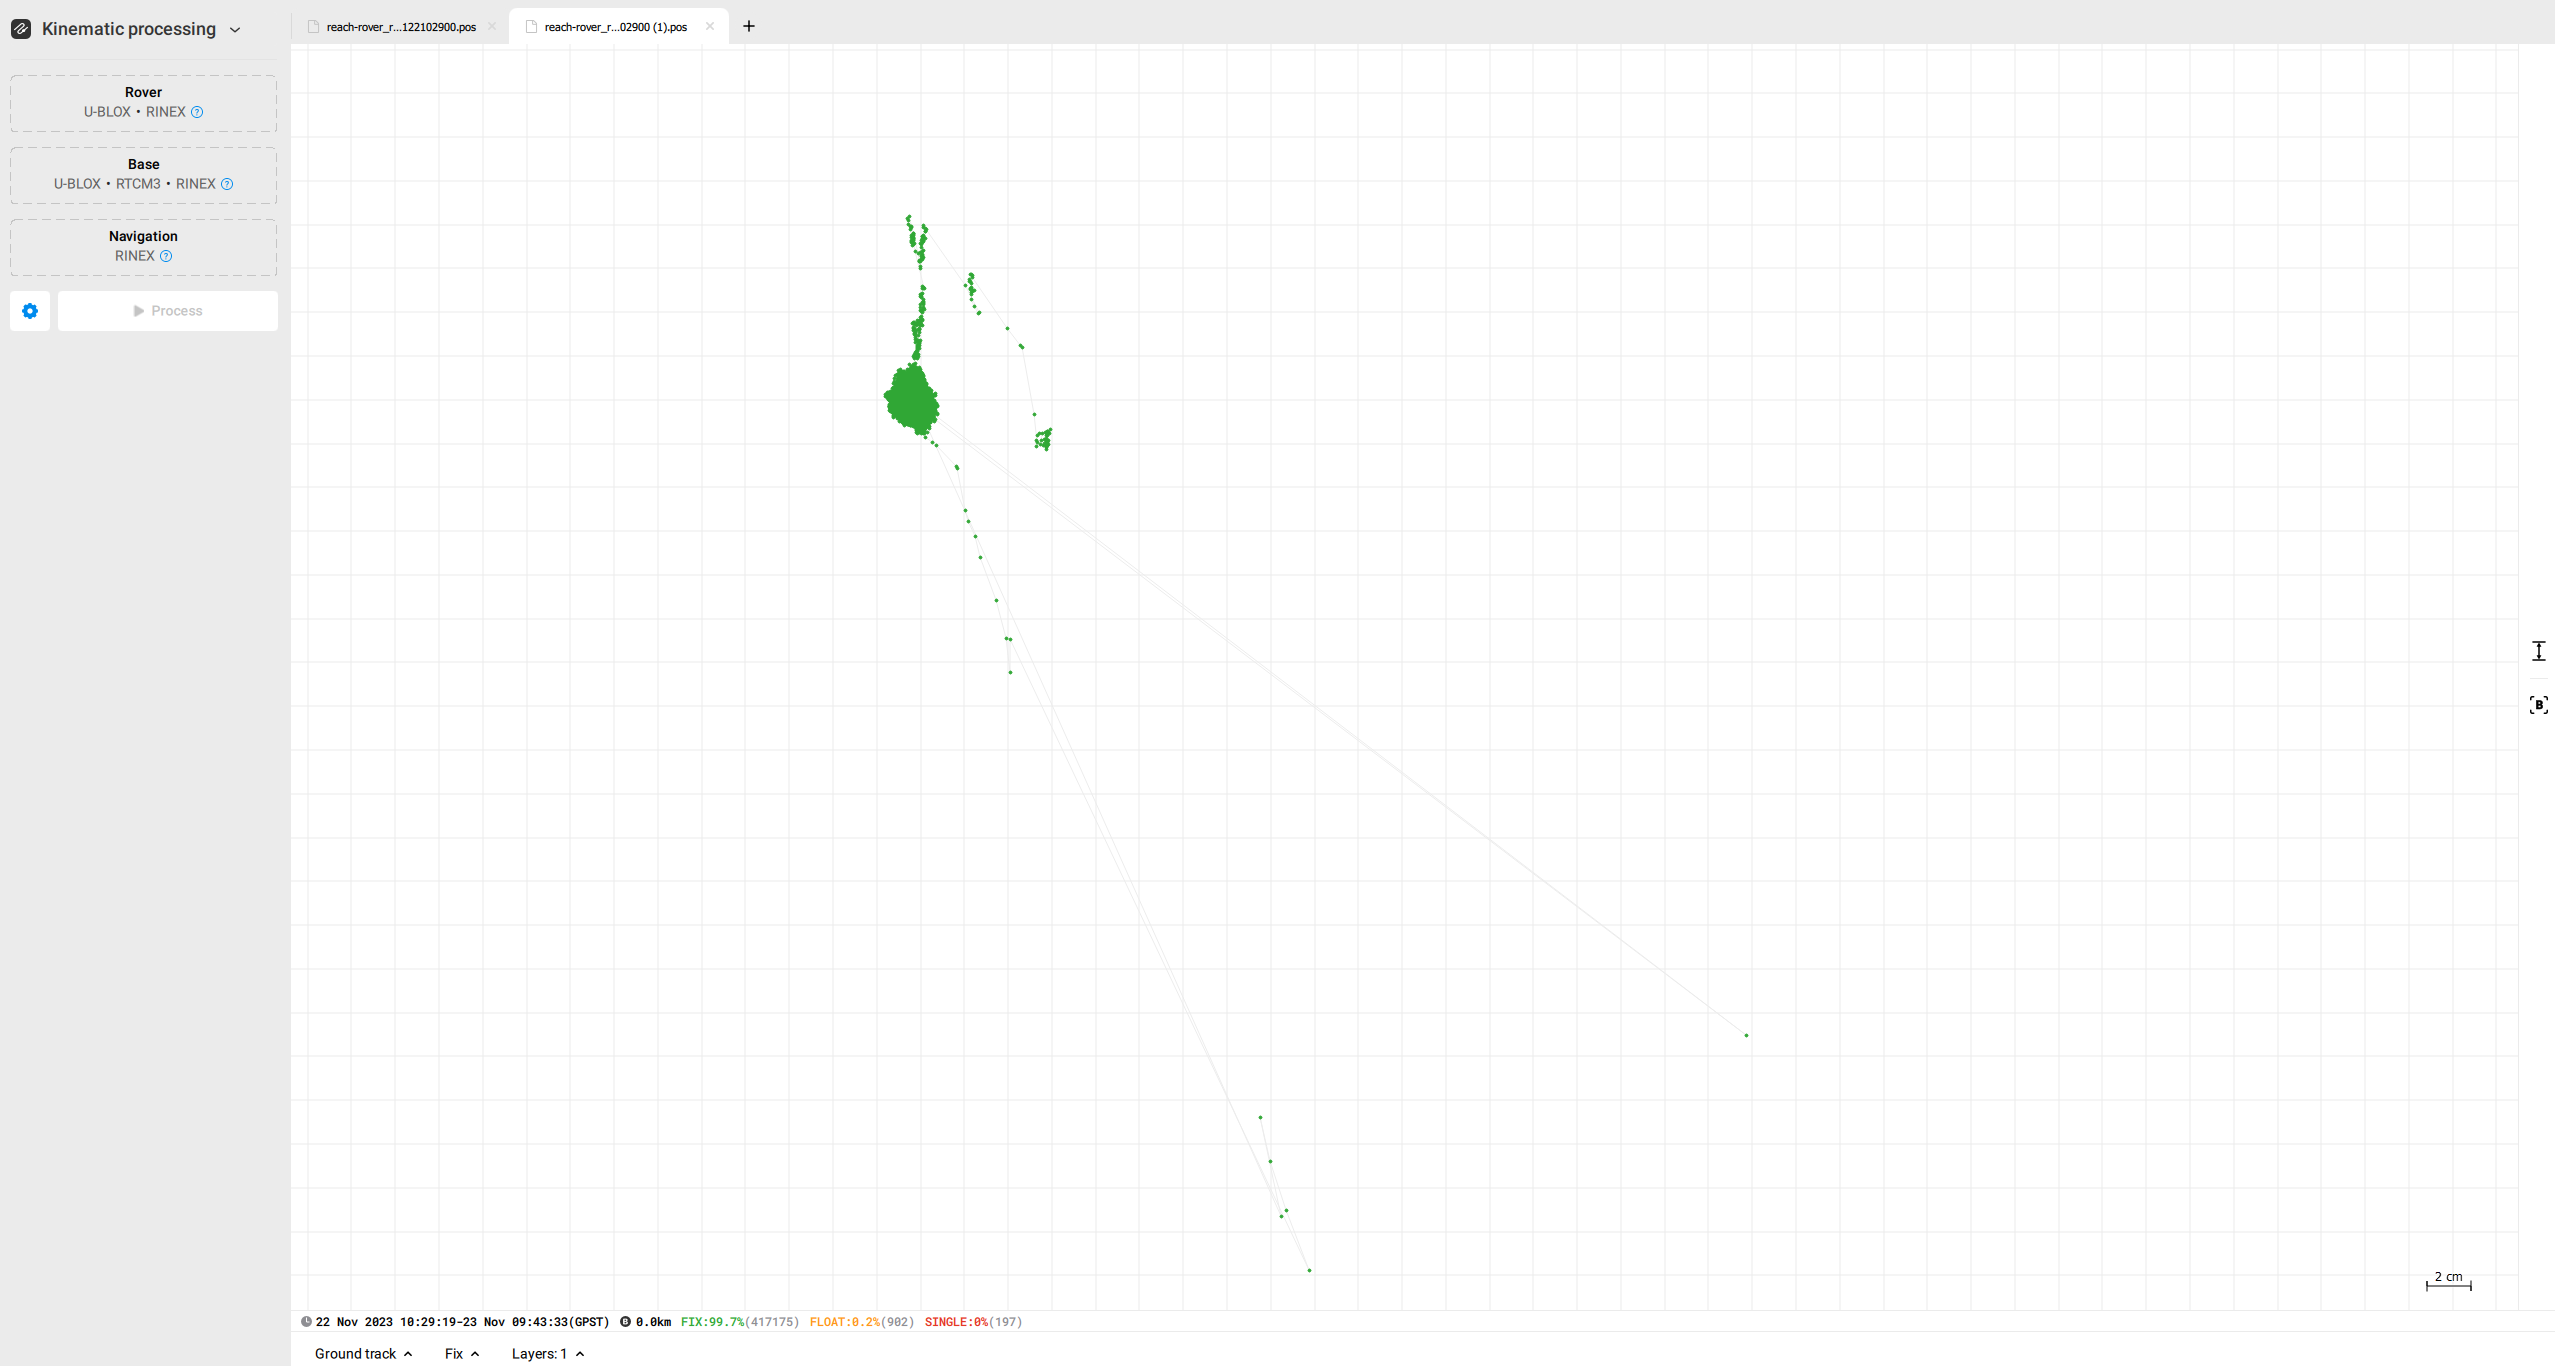
However, with post-processing the data when using the base coordinates gathered the day prior, the data is very inaccurate. When using the RINEX header the data becomes a lot more accurate.
So it seems this approach is not feasible?
This suprises me because I think I read on the forum that this approach is feasible, does anyone know what I am doing wrong?
Disclosed are the results from post-processing the data with both sets of base coordinates gathered.
I see from the first screenshot that the distance from the base to the rover is more than 6000km, which seems too far. Could you check the coordinates you entered in Emlid Studio? Did I understand correctly that you are averaging the base for 30 minutes?
Please share both the RINEX and collected coordinates used in Emlid Studio.
Hi @olesia.riman ,
Thanks for your reply!
Due to your reaction I checked my data again and I saw that in the manual mode I mistakenly filled in the latitude in the area for longitude and vice versa 
It seems that in reachview first the longitude is displayed and in emlid studio, the latitude is displayed first.
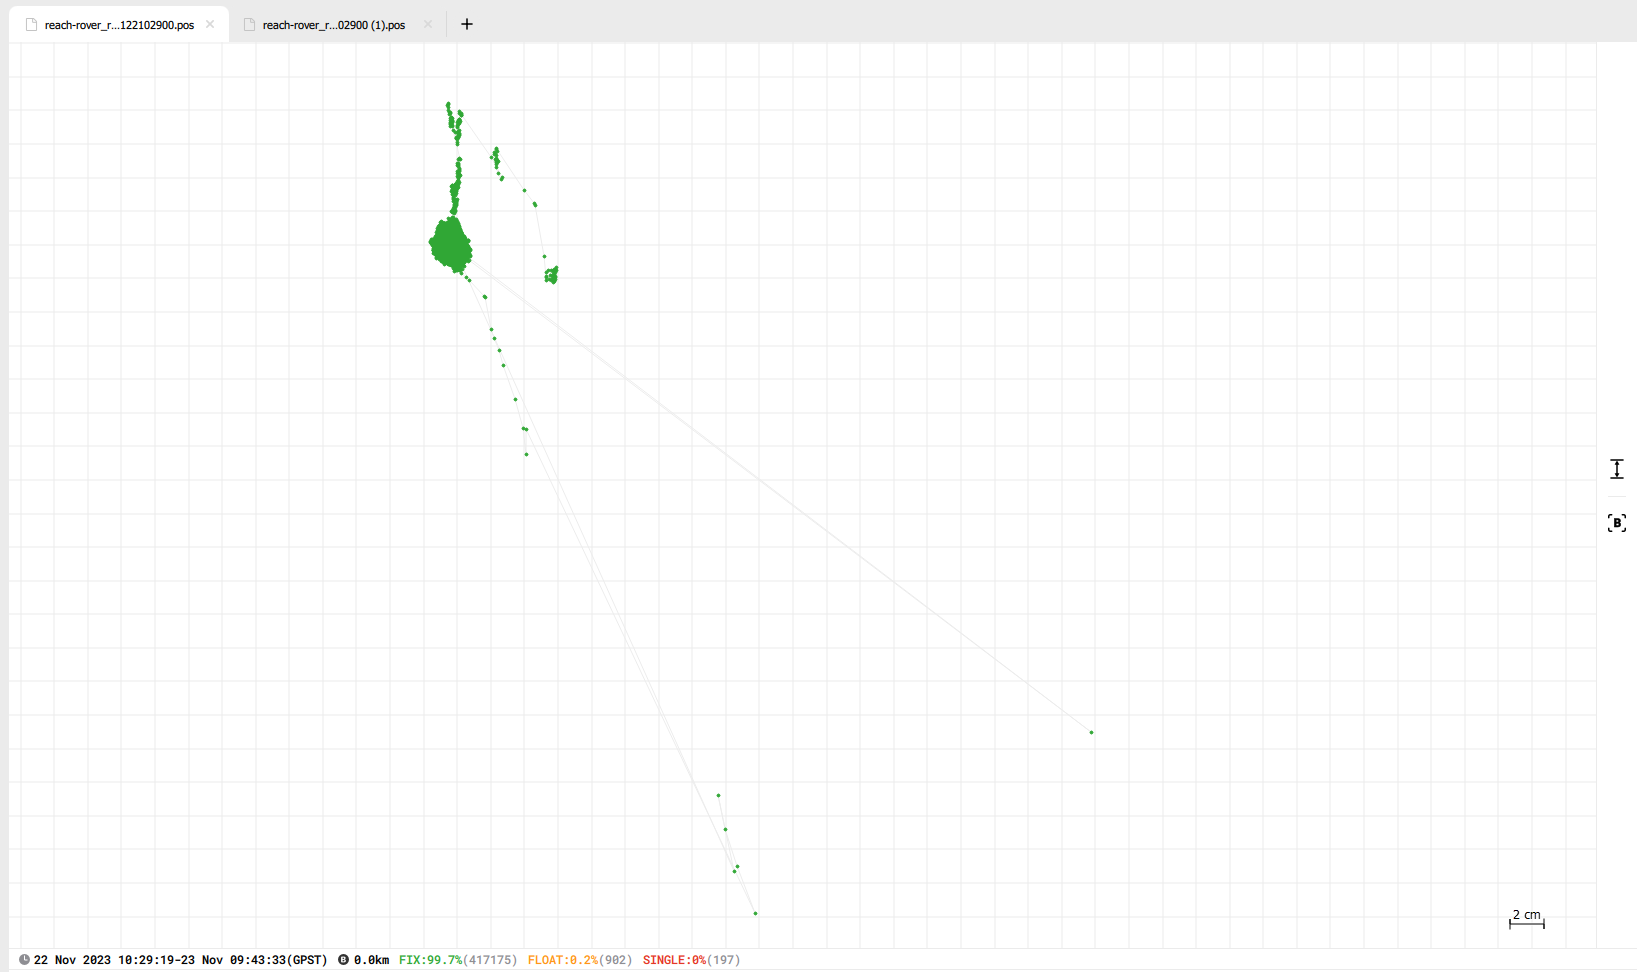
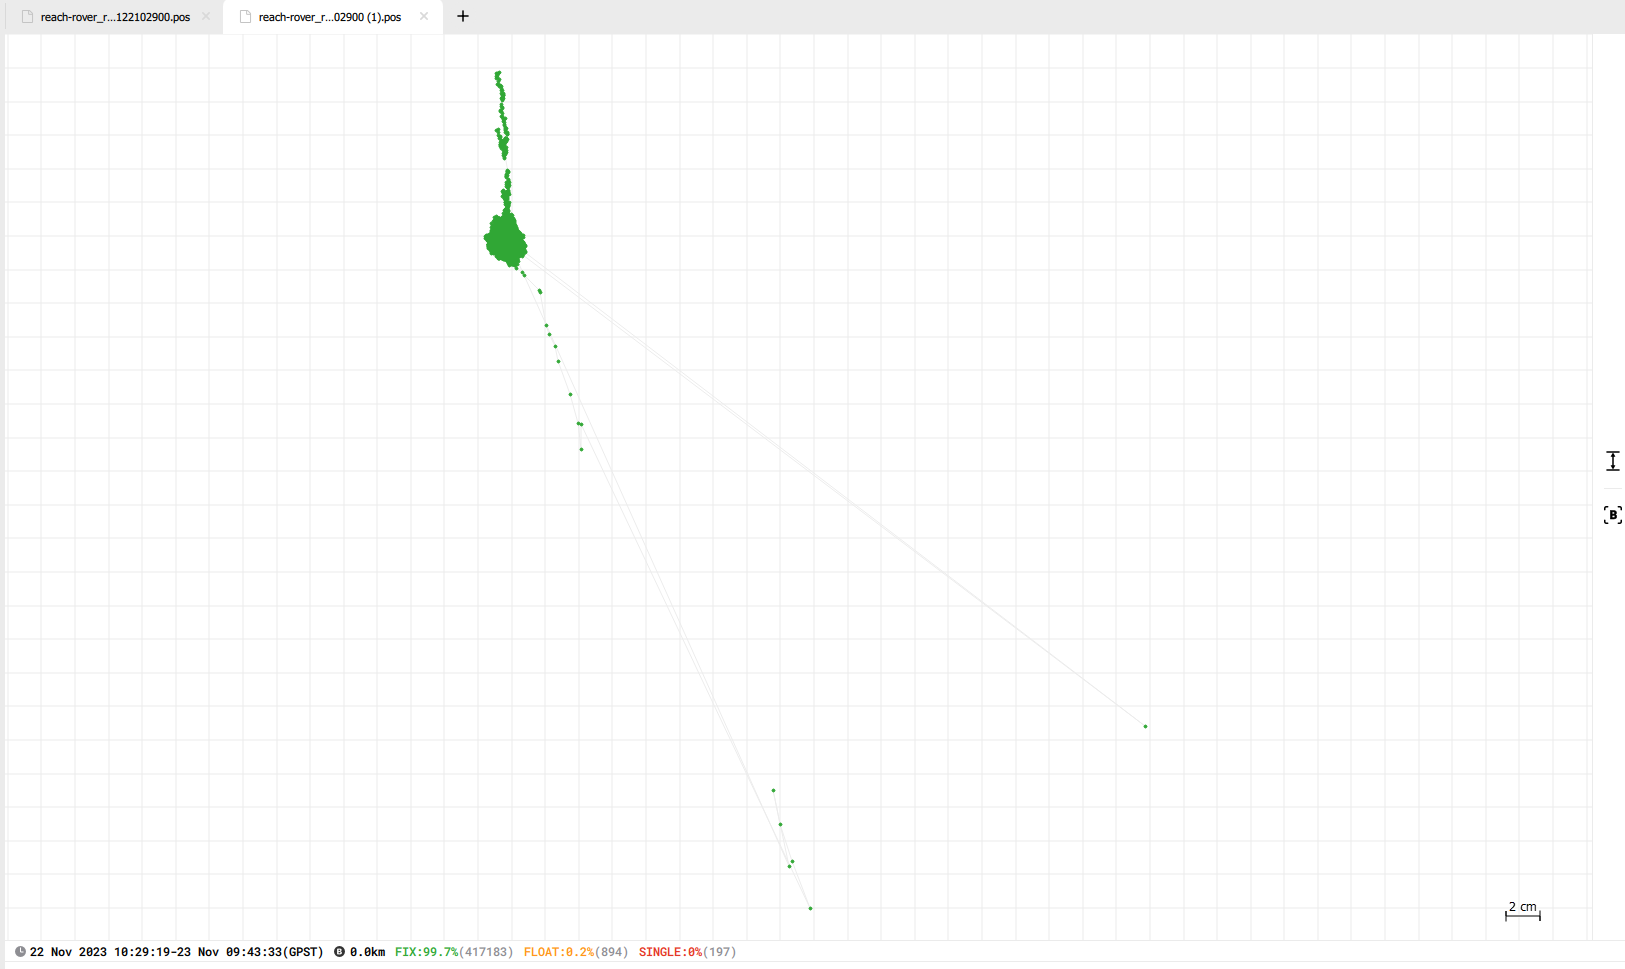
The two results are now a lot more comparable, the only ‘big’ difference is the ellipsoidal height. 43.043 m vs 52.8652 m.
Do you have any idea where this difference comes from?
Your base coordinates are different, is that correct? The first time, you entered them manually, and the second time, you took them from the RINEX header. This could be the cause of the different ellipsoid heights.
Yes that is true, I didn’t write it explicit but more what I ment was that the base is on the same position both times when it averaged its location. But the change in ellipsoidal height between those instances seems quite large to me (almost 10 meters), or is this expected?
Were you Averaging the position with a Single solution? if you average the same point in Single, the results are meter-level accurate each time, and won’t match.
The coordinates in the RINEX header represent the last calculated epoch coordinates and with them, you can achieve only relative accuracy. To ensure accuracy in post-processing, you need to input the correct base coordinates manually.
2 Likes
Yes that is true.
Alright then I will manually input the base coordinates each time.
Thanks!
1 Like