


Hello !!! I again … how can I do to include in RTKlib the descriptions of the points surveyed in Rechview. I need to see the file of the points in RTKplot to be able to see them and export the fixed data. I saw that in EZsurv, in addition to uploading the Rinex file, the points file must be included in another tab. How can I do it in RTKLIB? look in the manual and I can not find it and if anyone knows how to do it in GNSS solutions I would appreciate it.
Luis
This is of the places where RTKpost meets its match.
Basically for to find your points, you input start/stop times from survey-points manually into RTKplot. That will then give you a position in 3D and an RMS. Repeat for each survey point.
Is this only in visual form or adding a time file? In one example I saw that in EZsurv two files are attached to the ubx and the points file. I do not have the money to acquire Ezsurv and I want to be able to do it in RTKliby I do not know how to proceed?
In RTKPlot -> Edit -> Time Span / Interval
I am going to try
It’s painful, but doesn’t cost you the same as a Reach RS+ kit 
:alegría:
https://drive.google.com/file/d/1-iFY2AY9i0wGNAkJRnEDuCvhKH0GOoVC/view?usp=sharing
https://drive.google.com/file/d/1nf5LwtbbxgHtiHmCMI_eKOSudwRerDmn/view?usp=sharing
Casa_centro.zip (570 Bytes)
I do not know how to determine the coordinates of the static points and how to link the descriptions of the measured points
Your rover is sub-optimal, with quite a bit of cycle-slips. When you walk your route, do you keep your rover-pole upright and try to avoid anything that can compromise your sky-view ?
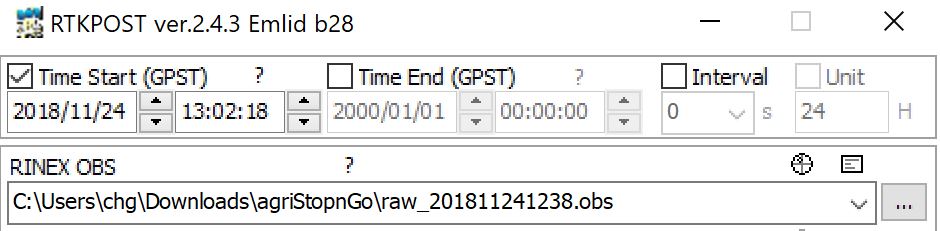
I could only decent results with RTKpost if I used the Static-start for positioning mode, and cut out the beginning.
With that in place, you can now start the time-span process.
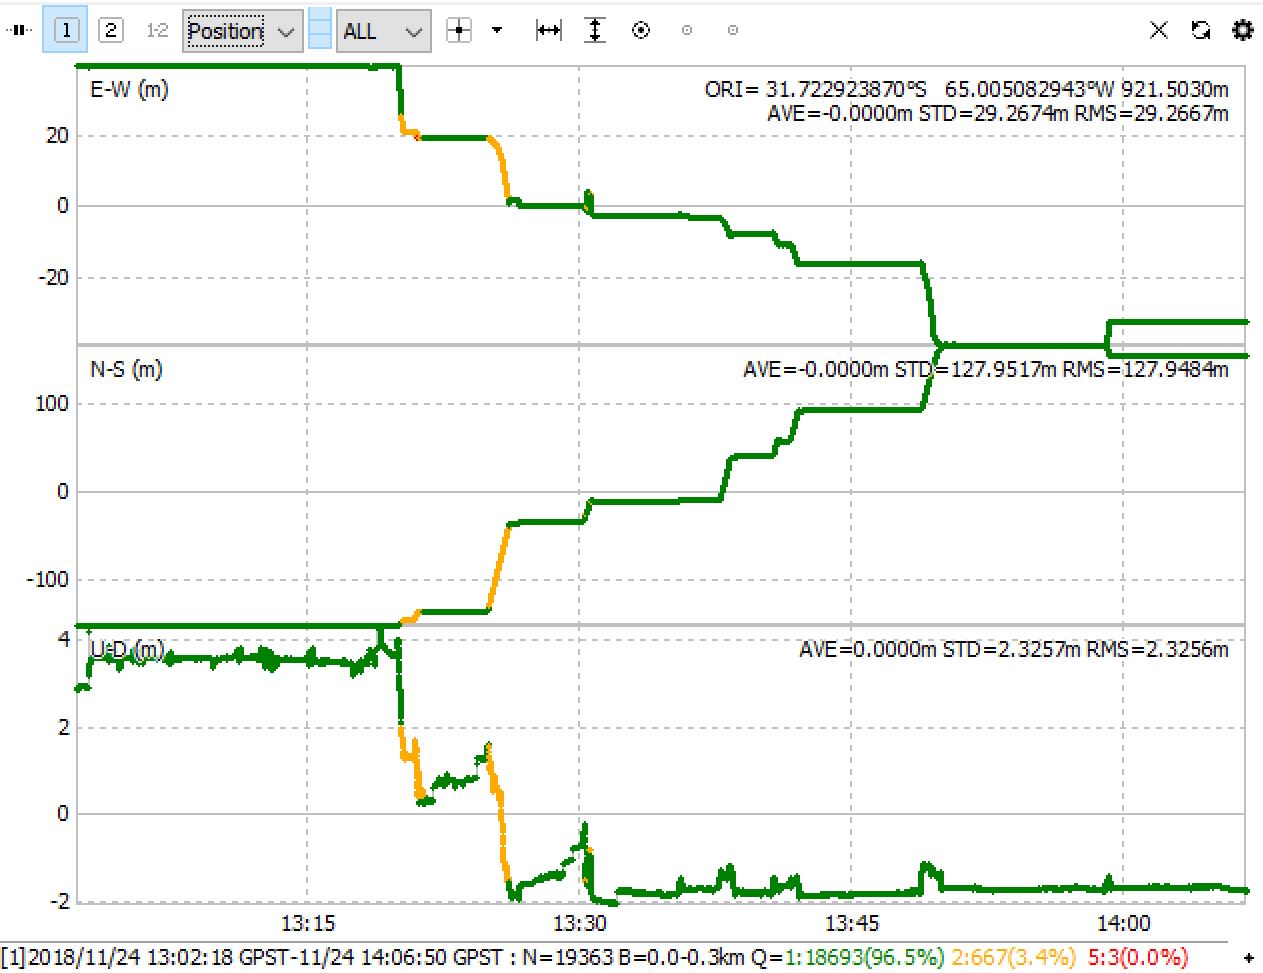
Looking into your CSV file, for the example purpose, let’s take the reading your have with high RMS (0.3 m), Escalera.
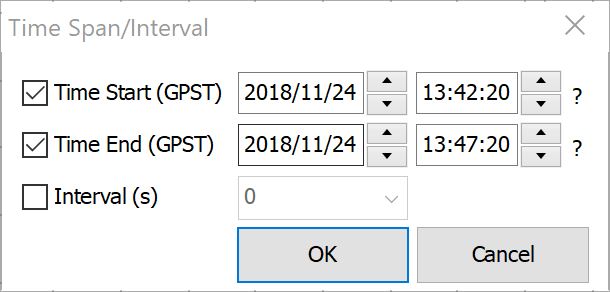
It starts at 13:42:20 and ends at 13:47:20, so let’s input that into RTKplot:
Which results in:
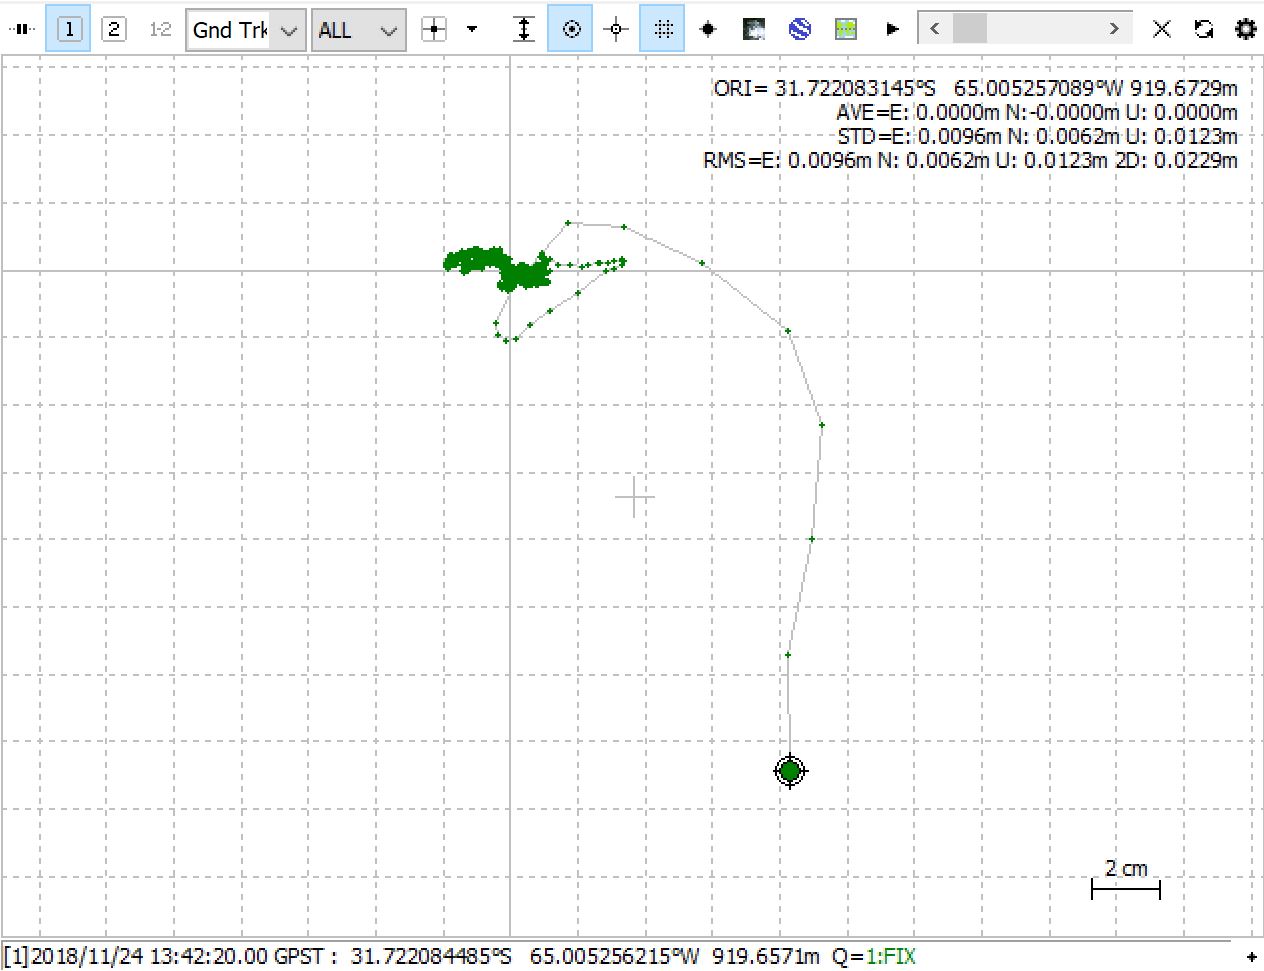
As you can see there’s a small precursor, I’m guessing you might not have been completely settled when you started your survey?
If we cut away 7 seconds of the beginning (by again adjusting the time-span), it looks like this:
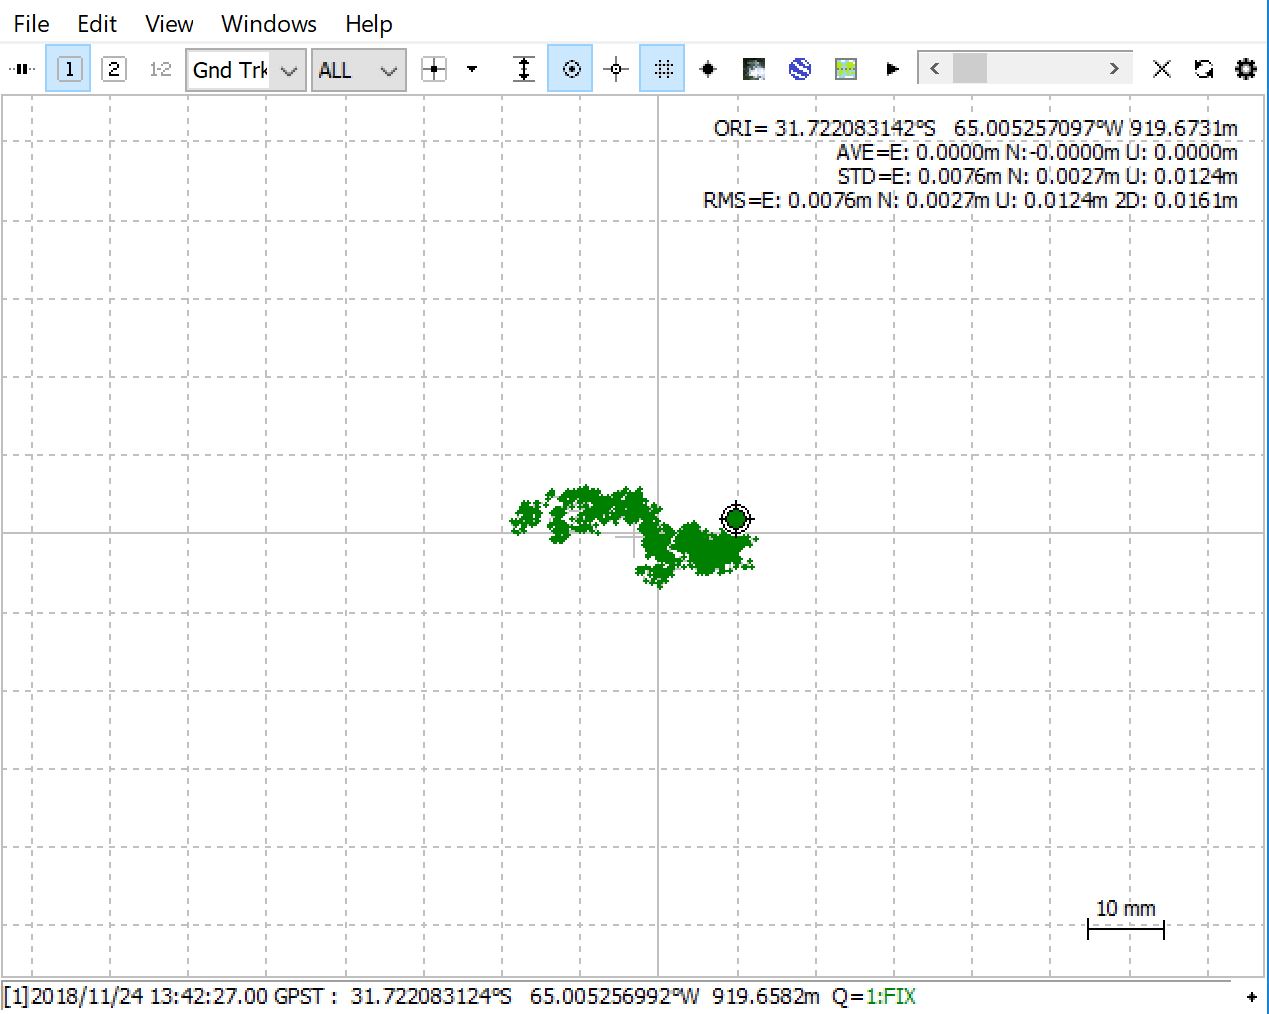
So instead of an error 0.3 meters in a Float solution from RTK, we now have 0.0161 m error from a Fix solution 
While it might be fun to compare the 3d coordinates now, it doesn’t really make sense, unless you know the Base coordinates used for the RTK solution?
It is an area with many trees and the base with obstacles, take measurement marks that I already had as fixed points, now I see what results.
Then there is no way to include the file of points in> RTKlib as in EZsurv, you have to go looking for the intervals manually and go solving each floating point individually. Thank you
No, it’s all manual, and time-consuming :S…
Hopefully Emlid will get to make a working stop-and-go flow, this example clearly illustrates why that is so important!
1 Like
If we wait, because when I lose RTK precision I must process the static data of 5 minutes.
I saw on YouTube that it is very easy to process with Ezsurv but I do not have 1600 US dollars.:no confundido:
how is it done to process after the times have been indicated in time span / interval ???
You mean, if you haven’t got the time-stamps from the survey file?
If Christian I have them, I enter them in time stamp but I do not see the result for that certain time? Do I have to reprocess? I do not see the same screen as you
Hmm did you put time-constraints on the processing as well?
In processing I must also set the interval? or is the first thing I have to do, limit the time in the processing interval.
will the rtkplot be well configured to see the results?
In this specific case, you need to cut-off some of the beginning, as you have a lot of crappy signals in the beginning.
Here’s how I set RTK post up for your data:
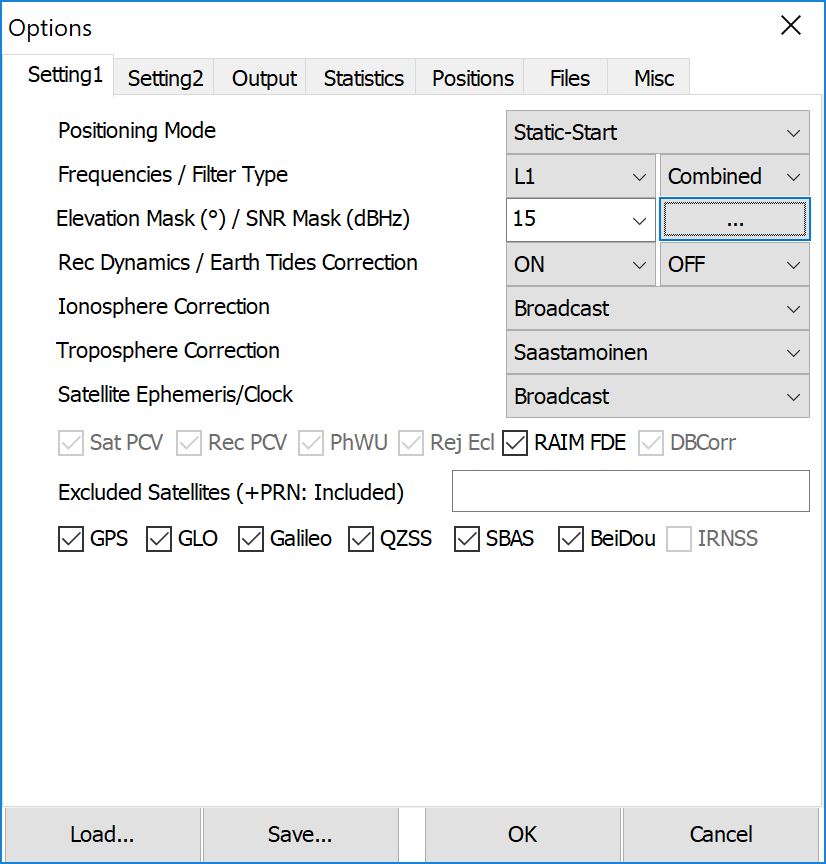
SNR filter is set to 35, and AR mode is Fix-and-Hold
1 Like
how did you assign the averaged value to a waypoint and then download it to my autocad project
In RTKPlot you can add points to “Waypoints”. This list can then be saved. If that list can then be imported to Autocad, I don’t know.