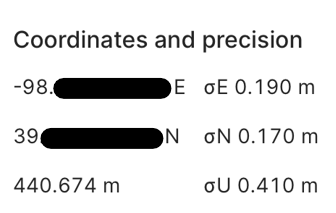
Newbie…With the values shown, do the 190mm & 170mm values suggest the total offset distance with respect to the mounted GPS antenna (manual coordinates were entered)? So, on each side of antenna, 1/2 of these values.
In farming using WAAS, they say 6-8" pass to pass accuracy, and those two values represent 7.5" (190mm) and 6.7" (170mm). So I suspected a possible relationship if say driving N/S or E/W directions.
Analogy: Imagine you’re playing darts, and you throw 10 darts aiming for the bullseye (the center). After throwing all your darts, you measure how far each dart is from the bullseye.
Explanation: Standard deviation is like looking at how spread out your darts are from the average position of all your darts. If your darts are all clustered tightly together, the standard deviation is low, meaning you are consistent in where you throw, even if you’re not hitting the bullseye.
In GNSS: This tells you how precise your GNSS measurements are – how consistent your position estimates are around an average point.
RMS (Root Mean Square)
Analogy: Now, instead of just looking at how spread out the darts are, you calculate the average distance of each dart from the bullseye and take the square root of the average of these squared distances.
Explanation: RMS is like measuring how far, on average, your darts land from the bullseye, considering both the average position and the spread of your darts. This gives a single number representing your overall accuracy.
In GNSS: This combines both the average error (how far off your measurements are from the true position) and the variability (how spread out the errors are). It gives you a sense of the total error magnitude.
Summarizing the Differences
Standard Deviation: Measures how close your darts (positions) are to each other. It shows precision.
RMS: Measures how far your darts (positions) are from the bullseye on average. It shows overall accuracy.
In simpler terms, standard deviation is about consistency in your throws, while RMS is about how close you actually get to the target.
FWIW: I was puzzled why CORS use 10 digits, and Emlid 8
How Many Decimal Digits for Storing Longitude and Latitude?
Summary: 7 digits are sufficient to store coordinates with centimeter accuracy and 8 digits are enough to store coordinates with millimeter accuracy. Additional digits right of the decimal point will lead to micrometer or nanometer accuracy, which is not relevant in most geospatial applications.
@phainein7, from my side, I only wanted to note that, as I understand from the screenshot, you didn’t have a FIX solution. Are your results sufficiently accurate? If you’d like to improve it, I can help you with possible options.
Just exploring this topic, and wanted to get a handle on the accuracy side. By Googling around, I found some tidbits that assisted in understanding this topic, for instances,


