Today was my first chance to use the system mounted on my tractor for field work.
I’m receiving corrections from a VRS NTRIP system over the internet with a wifi hotspot.
When running the system would move between RTK float and Fix, with it being in float ~60% of the time.
This is in a wide open field. GPS antenna mounted on top of the cab with a 6" steel plate at the ground plane. Reach was seeing 22 satellites most of the time, 15 were being used with the correction signal.
A couple questions:
Is this the performance I should expect with regards to fix vs float? I was hoping for a more solid lock, especially since it was ideal conditions.
When bouncing from fix to float, te position would shift 20-30cm. why does it shift when it hits RTK fix?
I probably missed some details to help answer all the questions and will gladly fill in as we discuss.
The one called .UBX is raw, but send them all might be an idea to see how data is processed on reach.
Put them in dropbox, google disk or something and share link is ok
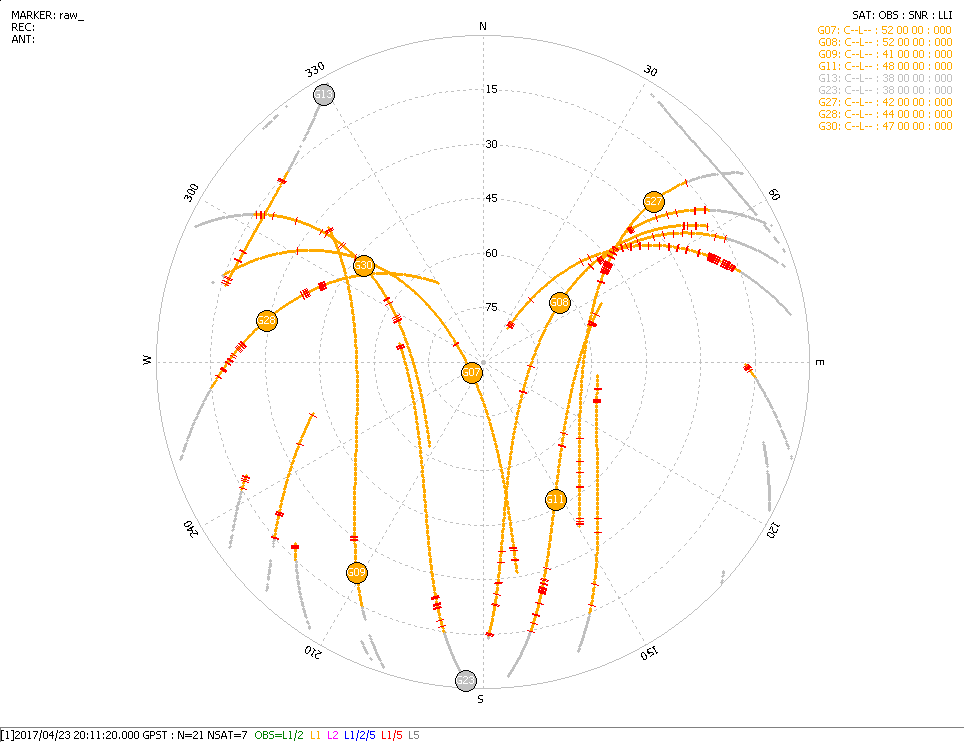
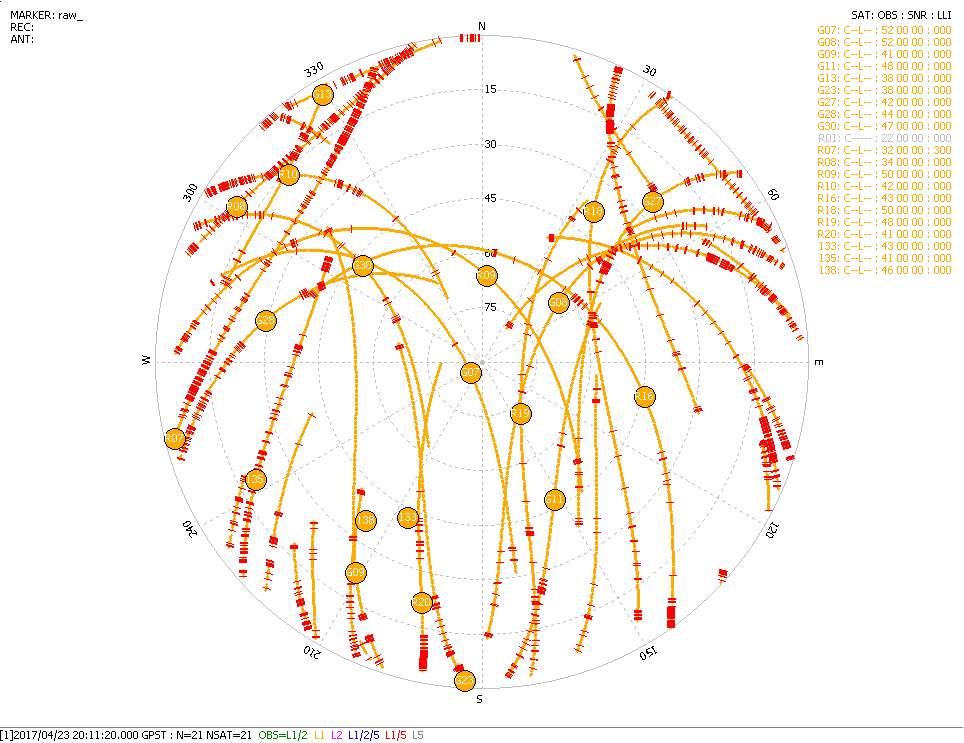
RTKLIB can handle a few cycle slips now, but if they happen on several satellites at once, then you have a problem (the short red lines in the pictures). Be it RF interference, antenna blockage, obscured sky, etc.
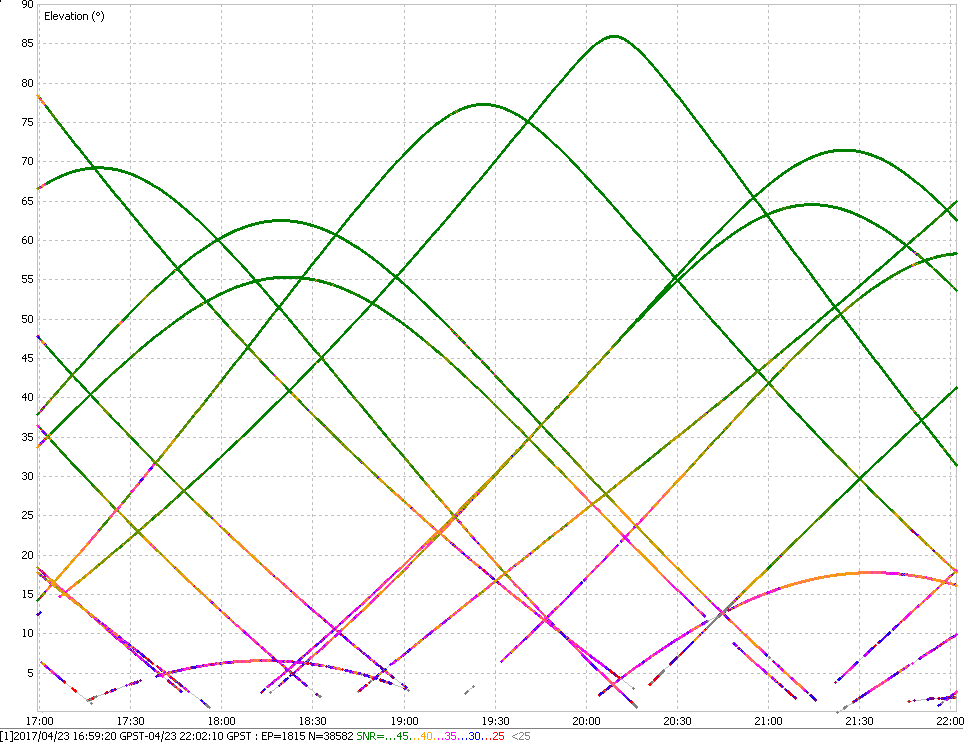
This is just showing the GPS satellites with a normal elevation mask. This is what is normally used to regain a fix:
In the elevation map above with only GPS sats showing, you have 6 sats green, which is good, but if you look closely, some of those SNR levels are actually repeating yellow green yellow green, which is not ideal.
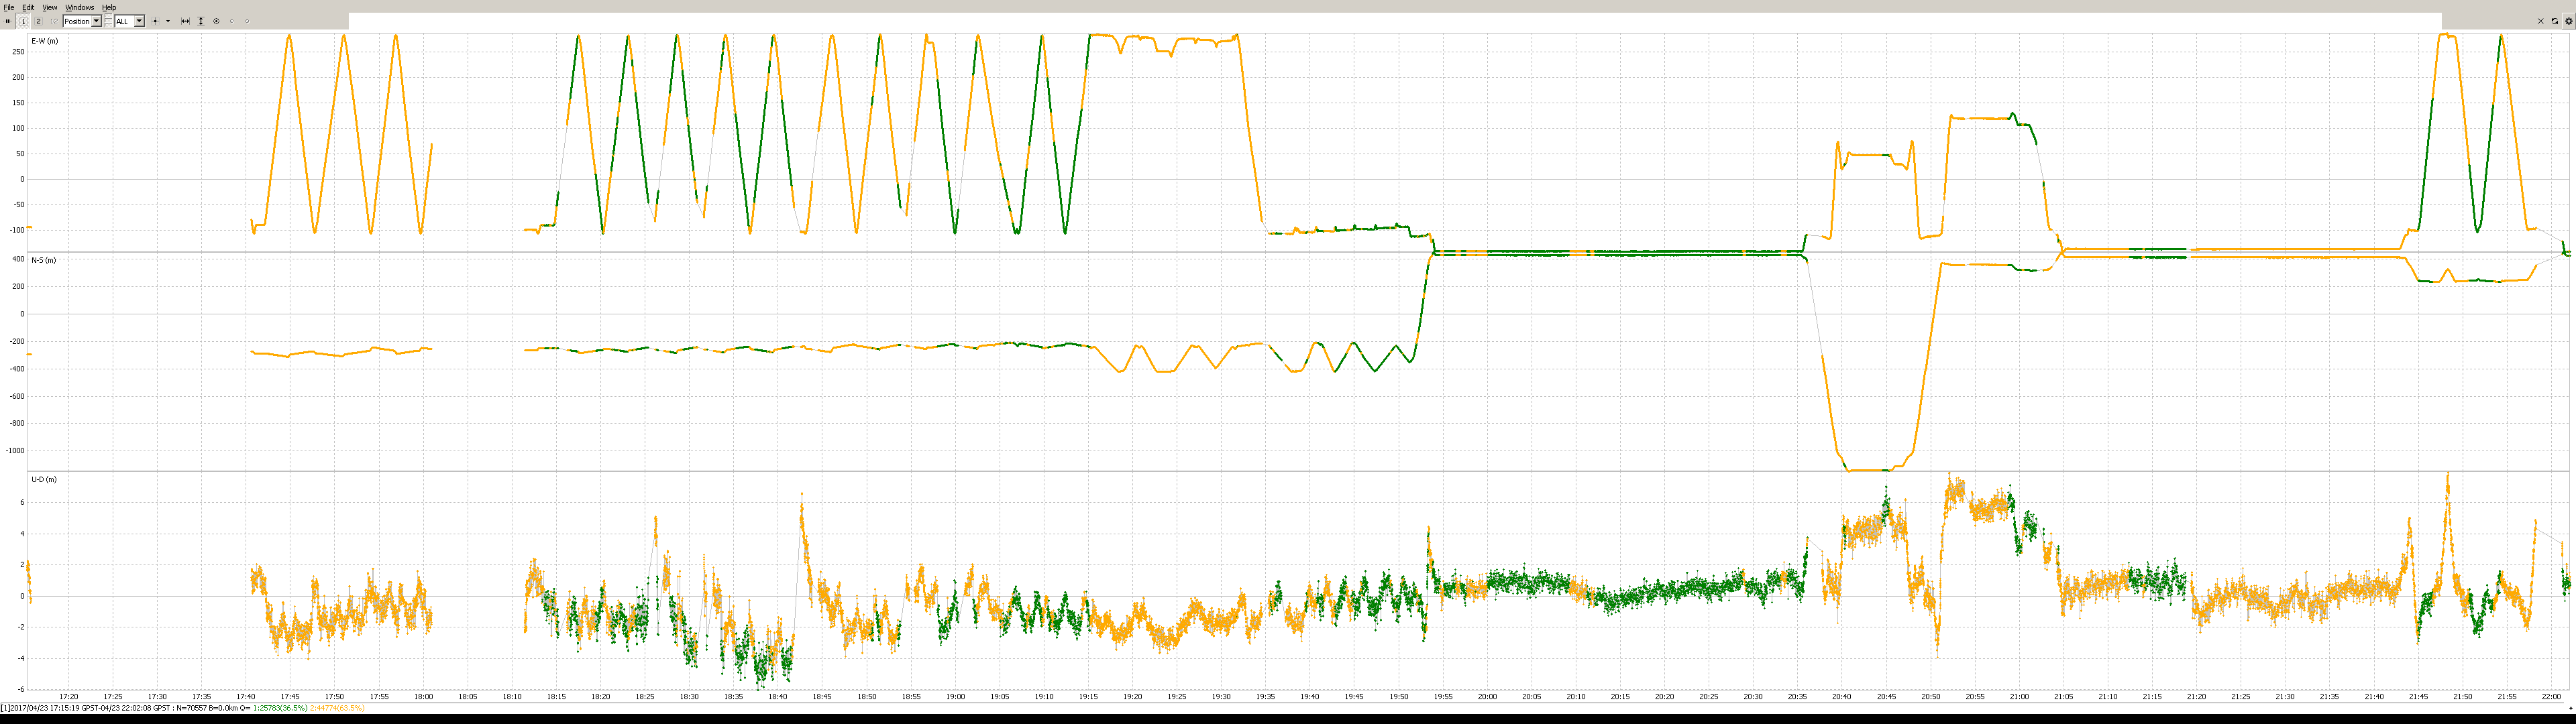
Tried the .ERB file and it looks pretty good to me, float with singel the last 50 sek, but before that almost only green fix.
Was this not your experience?
@TB_RTK I agree that does look pretty good. Did you shorten up the time shown in the ERB file? It looks like 5 hours of data up above, but surely that is not 5 hours of driving shown on the ERB plot. Unless it was going reeeeealy slooooow.
Thanks for being willing to look into this. Are there any adjustments or changes you would recommend I make to the settings or other diagnostics to try?
As for the time period, I was doing field work for about 3 hours. @TB_RTK there should be quite a few more back and forth passes prior to what’s shown on the plot.After I was done in the field, I let the system sit static for a couple hours.
I’m a newbie to this. what utilities are you using to look at the .erb file?
Is it normal for the position to jump when switching from RTK float to RTK fix?
The .erb file seems to be started up just about 30 min before finishing of?
You can use RTKplot to open this file.
Also files ended with the nr 56, doesnt contain any data. Other then that @bide seems to have covered most of it for the main file.
If you would do a second try, start logging from all (raw, output, correction data)
Is there a official site you get vrs data from?
And setting, not sure what you used but a screenshot would tell alot.
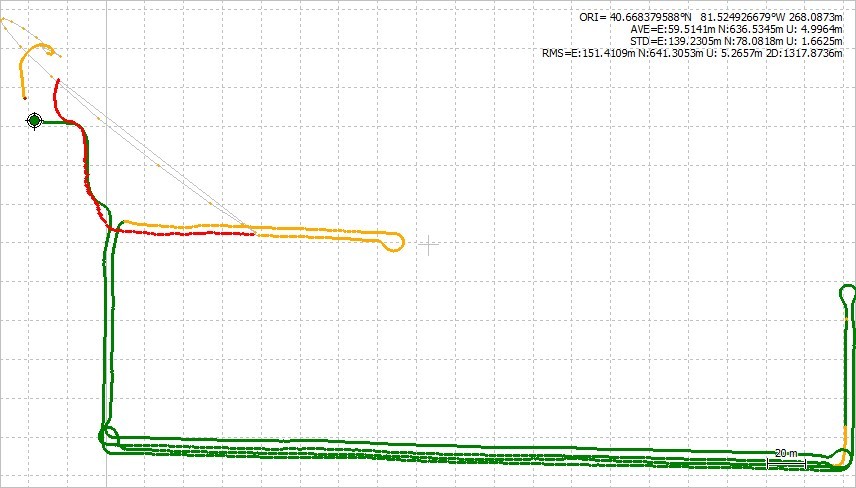
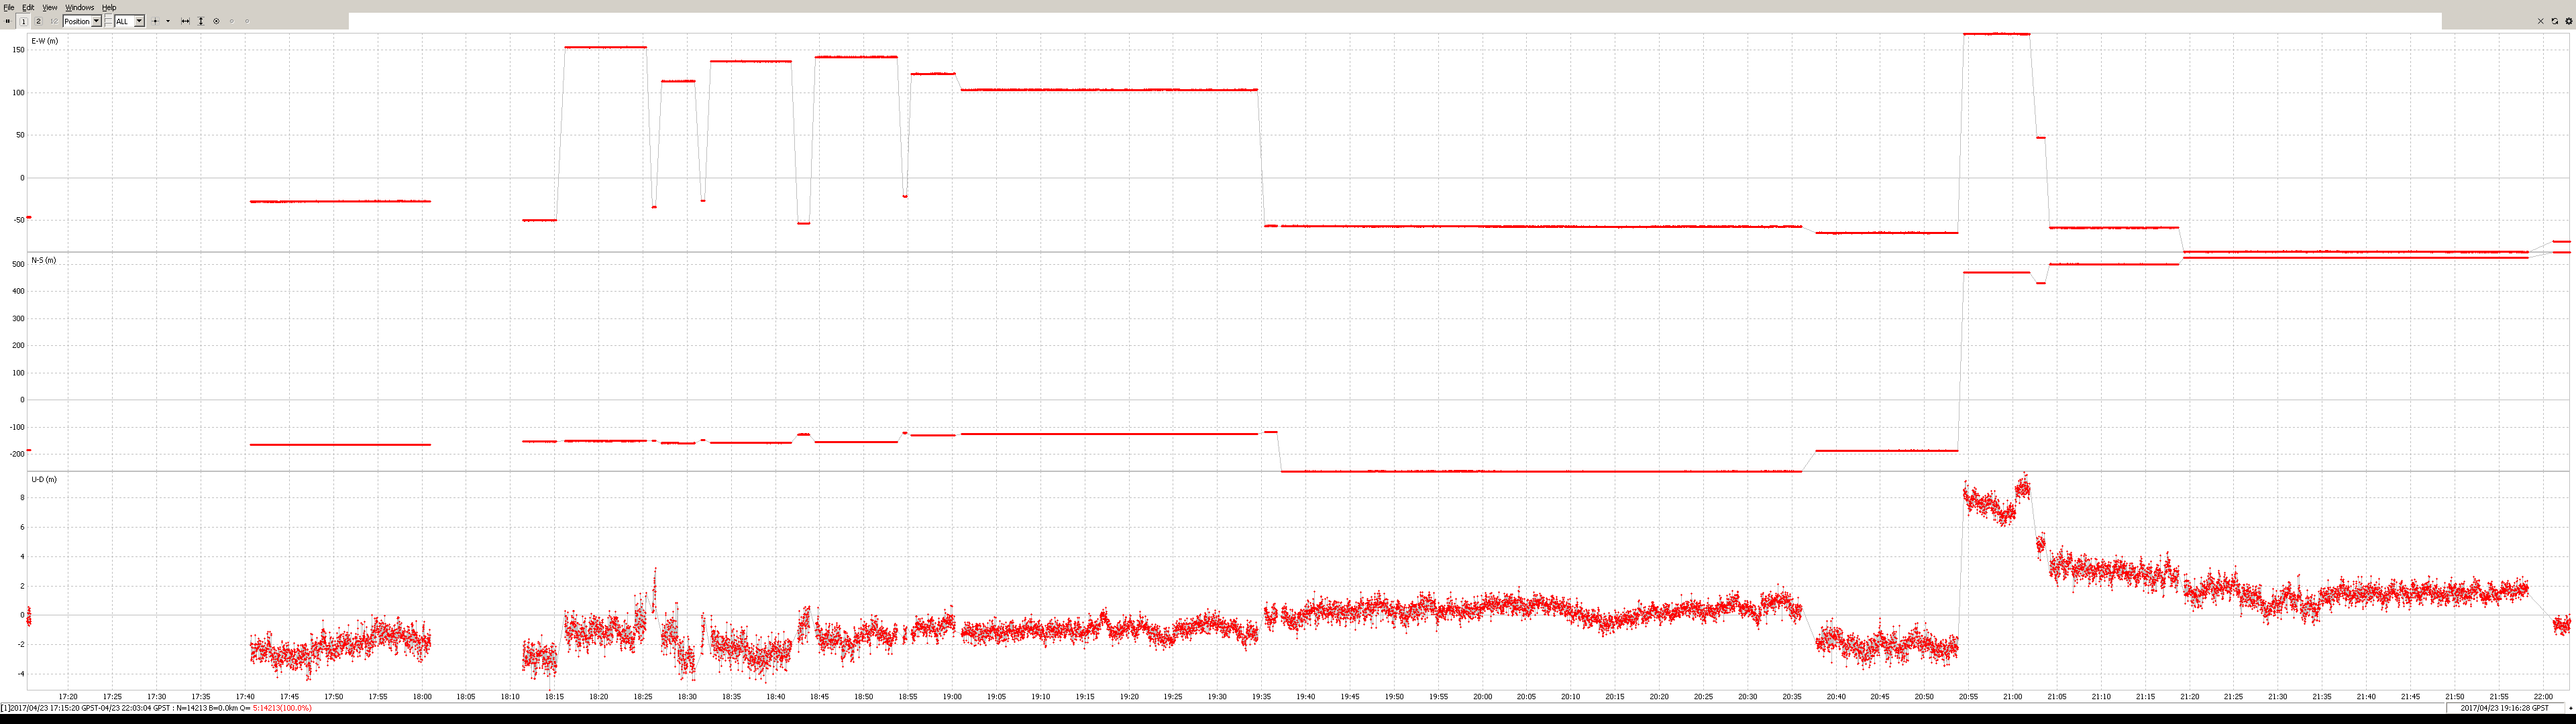
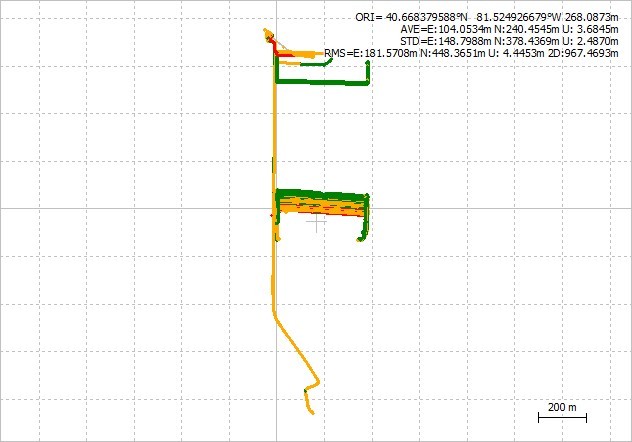
@TB_RTK I made some headway with this. I’m not sure why your ERB solution was only partial, but here is what I saw with the full .ERB solution file as displayed by the unmodified rtkplot.exe:
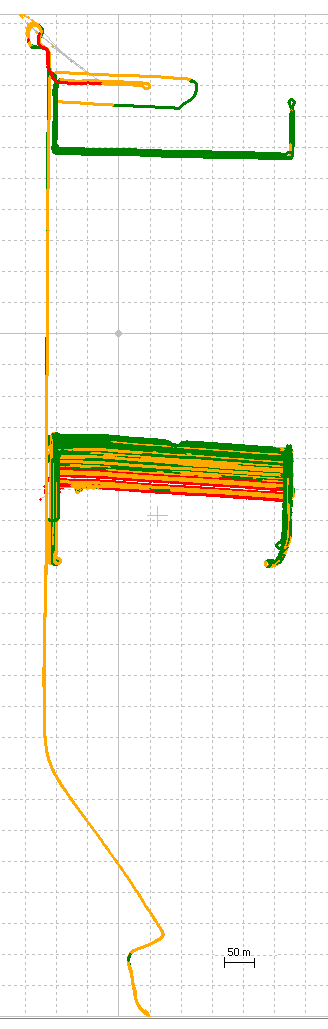
You can see that the base moves around from time to time. Such large movements too! ~200m! I speculate that you lost connection to the VRS, and when it reconnected, you got a new virtual base coordinate each time. I don’t think Kinematic RTK mode can compensate for such large base movements.
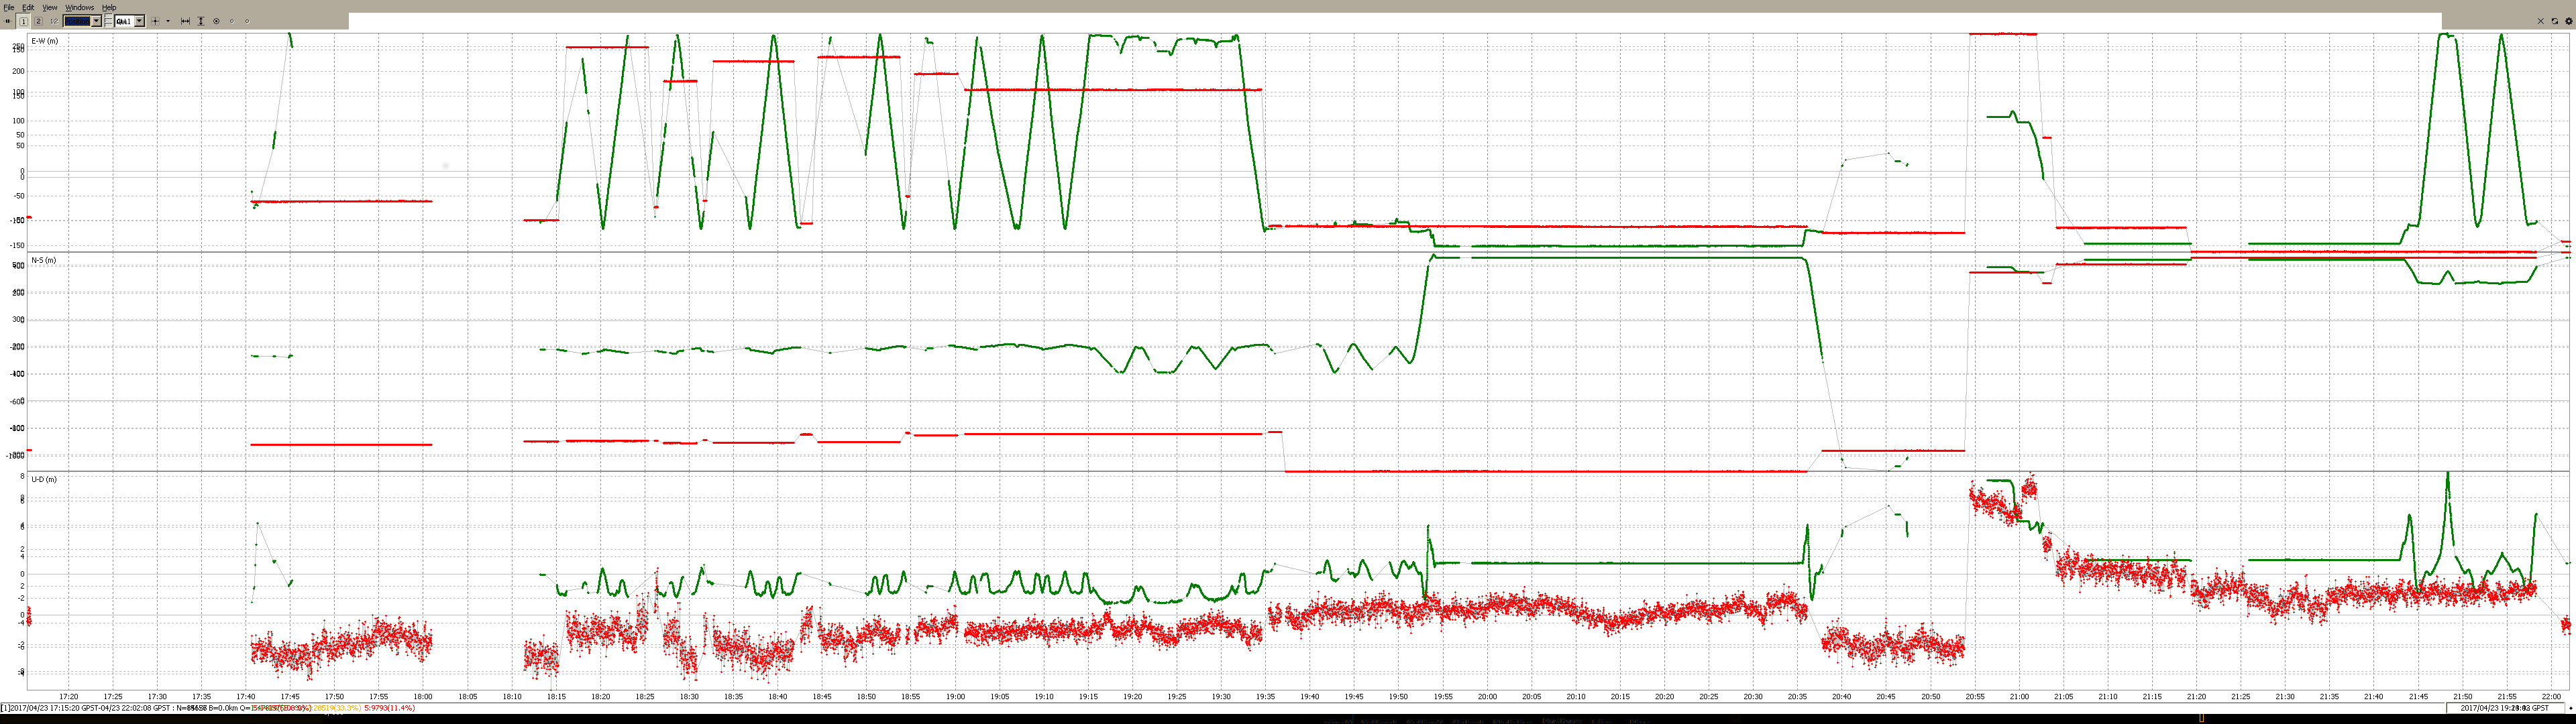
As you can see in this smaller overlay (red base single position overlaid over green rover fixed solutions) there are some correlations between changes in the base position and the fix status.
The next step would be to post-process each segment of time where the VRS base was stationary. Then one could analyze for problems within those segments. But I will leave that as an exercise for the reader (as they say sometimes).