I am setting up some semi-permanent control points. In this example I collected GNSS data with my RS2 mounted on a sturdy tripod for about 4 hours. I then performed PPK against four base stations, and also submitted my observations to NRCan and got a PPP rapid solution.
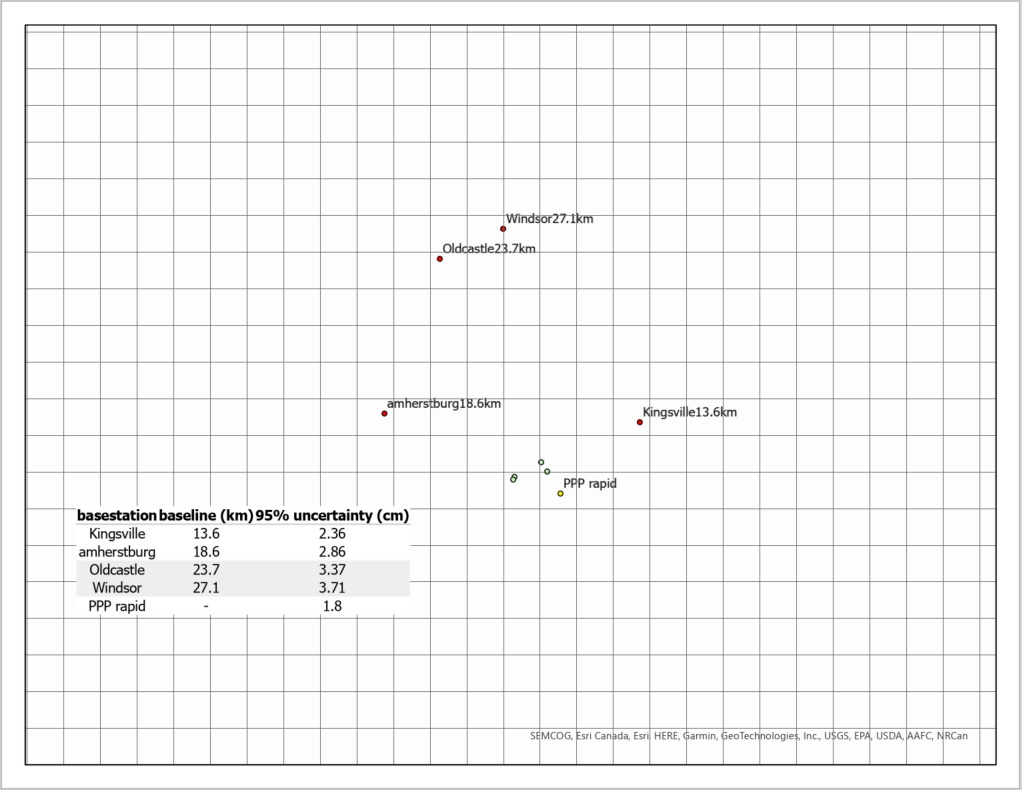
I calculated the expected uncertainty of the PPK observations (5mm + 0.5 ppm) and also looked at the reported 95% uncertainty of the PPP report. I plotted all the solutions on a 1cm grid and listed the baseline distances for each point. From looking at the solutions I have two questions:
If you draw circles of the uncertainties around each solution, for the most part there is no overlap. I would expect more overlap of the uncertainty circles if the PPK accuracy is to be believed. Is there a suitable explanation for this?
If you have 4+ hours of observations, which is generally more reliable, PPK off of a known base station or a PPP solution?
Here is a link to the observation data, base station data and PPP rapid solution as well as a plot of the results.
That’s very useful information, I didn’t realize the specs were for 67% error circle, thanks.
I have now attached the observations from the RS2.
So if I understand correctly, if the 67% certainty error circle with PPK is 5 + 0.5(x) where x is the distance to the base in km, then the 95% certainty error circle is 10 + 1(x), which means that the lowest the 95% error can possibly be with PPK is 10mm. This suggests to me that if you can observe for several hours, PPP should be used, because the best case PPK will only roughly equal the accuracy of PPP with a long observation time, PPK can’t be better. Am I following that through correctly? Thanks so much.
I also updated my chart of the results with 95% confidence values for all points.
Remember that PPK’ing from a CORS gives you physical tie-in to whatever system you are using. PPP from i.e. NRCAN will only give ITRF14 coordinates, and then you have to transform into what is locally being used.
Also remember that the error circle presented in the PPP report is about precision, not accuracy. For the PPK solution, given the CORS relation, you can talk about accuracy instead.
some good points. Also to consider, I’m using NAD83(CSRS) which does not have physical tie ins on the earth’s surface; all coordinates are determined by way of a 14 parameter time dependent transformation from ITRF14, including the coordinates of reference stations.
What I meant by physical tie-ins were official monuments that have official/certified coordinates coupled to them.
While they can obviously also be wrong, they are official.
@northernseals thank you for your research! It’s really useful and interesting topic, that may concern many people who work with precise measurements.
@wizprod thank you for sharing your expertise! We kindly appreciate it
I’d like to add that we consider PPP like one of the way to obtain precise coordinates in any remote area on the Earth. Even if there are no benchmarks, NTRIP services, an Internet coverage - you still have a chance to obtain an absolute accuracy. That’s why we highly value this technique.
And I agree with @wizprod, that using benchmarks may be a legal requirement of authorities which accept surveying results. Despite benchmarks may be founded inaccurate within adjustment networks, many surveyors all over the world have to rely on its coordinates.
@wizprod thanks so much for your insights I see where you are coming from re: the CORS/ reference stations are considered official. I feel more confident with my understanding after engaging in this thread.
Various accuracy/error estimates are just that - estimates and shouldn’t be taken too literally, but checking your work is always a good thing. I took a look at your data file and compared the CSRS-PPP values with two of the differential baselines - KNGV and ONAM. The values I got for the three are:
which happen to agree at the sub-centimeter level.
Now you have to be sure you are dealing with the exact same reference system and you are processing the data optimally for the best agreement. My CSRS-PPP values are slightly different than yours since I added the antenna model. The height value changed the most.
For the differential baselines I used the RINEX header values for the ONAM baseline and for the KNGV baseline values in the comments of the RINEX file, not the actual header ones. Why they do this - the values are slightly different - I don’t know. For serious work you would confirm these values, but the results are so close they are probably all from the same reference system.
Processing was with the latest RTKExplorer software and in addition to using the appropriate antenna models the ionosphere and troposphere were modeled with the TEC and ZTD options. My guess is you didn’t use these options which would tighten-up your baselines a bit.
In short things look good and error estimates do overlap.
Thanks so much jbonde002. I tried to reproduce your results for the KNGV base using the base coordinates in the comments of the rinex as you said and the TEC and ZTD options and I got similar but not exactly the same results as you:
42 01 32.8843 -82 53 57.6818 158.4165m
Note that my rover height, reference mark to antenna phase centre was 1.7433 m which includes the 0.134 m from the bottom of the RS2 to the APC. It seems you may have added the 0.134m a second time since your height is different by approximately that amount.
For the Ionosphere and troposphere options, I’ve always used Broadcast and Saastamoinen respectively. To emulate your results I set my options to Ionex TEC and estimate ZTD respectively. Did I do that right?
Now for RTKLIB-type software most people probably process with the iono and tropo settings at the defaults of Broadcast and Saastamoinen respectively. That’s basically the same as setting them to Off or assuming everything cancels with differential corrections. It does pretty much, but using Estimate TEC and ZTD+grad can improve the modeling a little.
Processing with Broadcast and Saastamoninen (or both set to OFF) I get:
42 01 32.8842 -82 53 57.6816 158.441 (KNGV base)
Processing with Estimate TEC and ZTD+grad yields:
42 01 32.8839 -82 53 57.6823 158.415 (KNGV base)
It’s not a big difference, but it’s a better comparison value to the CSRS-PPP coordinates. Why not always use these options? Well it’s not as robust and only amounts to perhaps a cm or two on longer baselines - at least horizontally.
When I did my processing I decimated all data files to a 30 second rate for ease of use. Processing the higher rate data you shared can yield slightly different results as can different versions of RTKLIB (even with the same settings) among a host of other variables.
thanks jbonde002. I must be doing something wrong because when I try to PPK using settings “Estimate TEC” and “ZTD+grad” off the KNGV base I only get Q=2 results. Would you mind sharing your full configuration in RTKPost so I can try it?
Below is the top of the *.POS file with the primary settings. The more detailed ones are probably all default. The only one which might make a difference that may not be default is base station interpolation is turned on under the Misc options. As I mentioned different versions of RTKLIB won’t necessarily behave the same.
Maybe note I’m only using GPS and not using any precise ephemeris. Also, again, the RS2 data file has been decimated to 30 second data with the GFZRNX utility.
jbonde002, I was able to emulate your results only after downloading the same version of RTKPost you are using; I was using an older version (2.4.3 Emlid b33). The results look great, and they are in much closer agreement with each other. I did notice that although results using ionosphere and troposphere modelling are much more accurate, they are more “noisy” compared to not modelling these things. The lesson I take from that is that modelling for troposphere and ionosphere should only be done with long observations so that noise will cancel out.
I noticed that you have specific entries for antenna1 and antenna2 (e.g. EML_REACH_RS2 NONE). Is that information you just manually typed in or does that have a deeper meaning?
Once again thanks so much I’m really pleased to get these results closer in agreement with each other.
RTKLIB can read the antenna type and offsets from the RINEX file if they are there. Under Options/Positions/Antenna Type using a ‘*’ will do this.
I did edit your rover file to add the antenna type and height offset so CSRS-PPP would use it and then had RTKLIB read it from there.
For the KNGV base file I did the same, but had to manually override just the position coordinates - using those from the comments. It read the antenna type and offset automatically.
I redid the PPK analysis for all the stations. They are in very close alignment now. Thanks so much for the advice. I added a new plot of the points displaying the solutions with and without ionosphere and troposphere modelling. I didnt label the solutions with the modelling included because they are so close together the labels would be confusing. That’s an amazing improvement. (the grid is 1cm squares)
I was only able to make this work using the RTKPost version ver.demo5 b34f.1