I have tried every possible thing I can think of to process my data through RTKLib. Below I will attach 3 different sets of files for observations I took the other day. The end goal is to have a base station reach and a rover reach on a moving platform. At this point I am trying to understand how to process the data with a very basic setup as described below. I have tried working my way through the steps on the GPS Post Processing Tutorial with no luck on obtaining a fixed position within the first steps using a known reference station (CORS site). I think I may be misunderstanding a couple of the steps involved and or what data to put where.
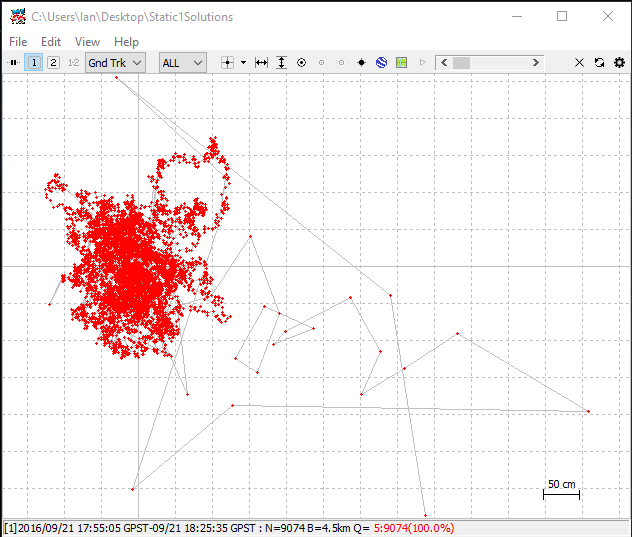
Static- Both Base Reach and Rover Reach never moved during data collection.
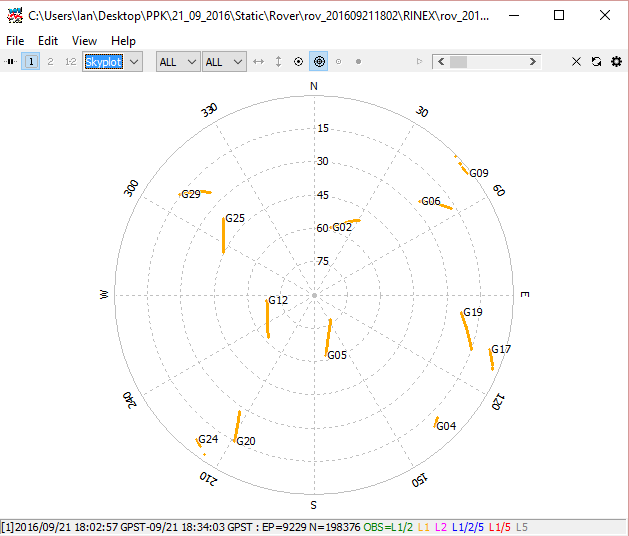
Static2- Same process at Static but with the Rover Reach in a different location.
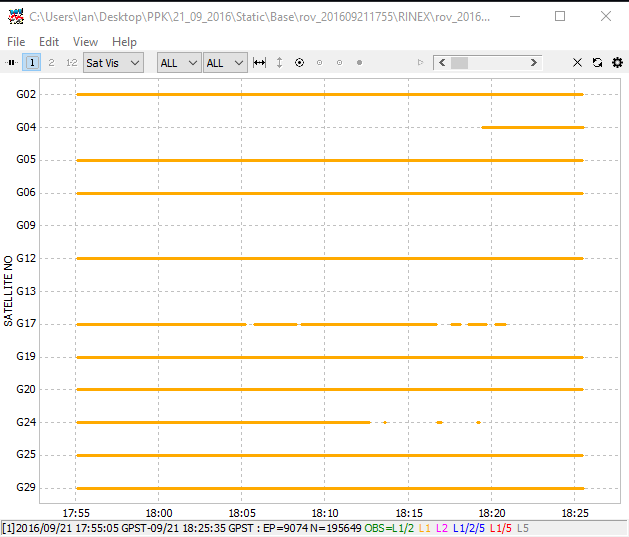
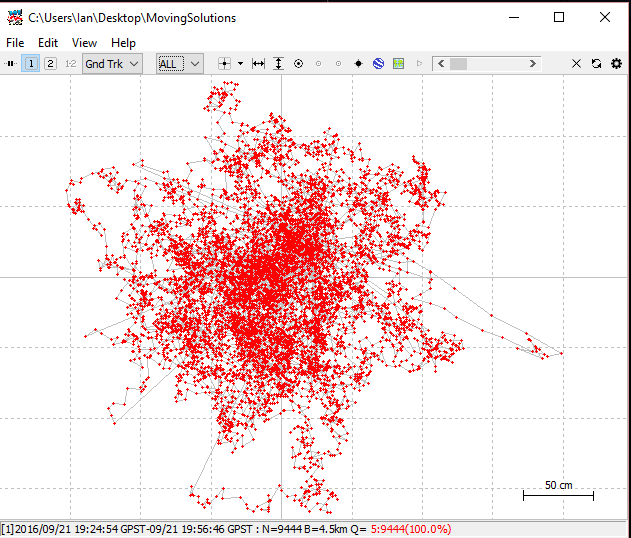
Moving- Base Reach was stationary the entire time, Rover Reach was stationary for part of the time and then I walked around the driveway with in and then returned it to a stationary position for the remaining observation.
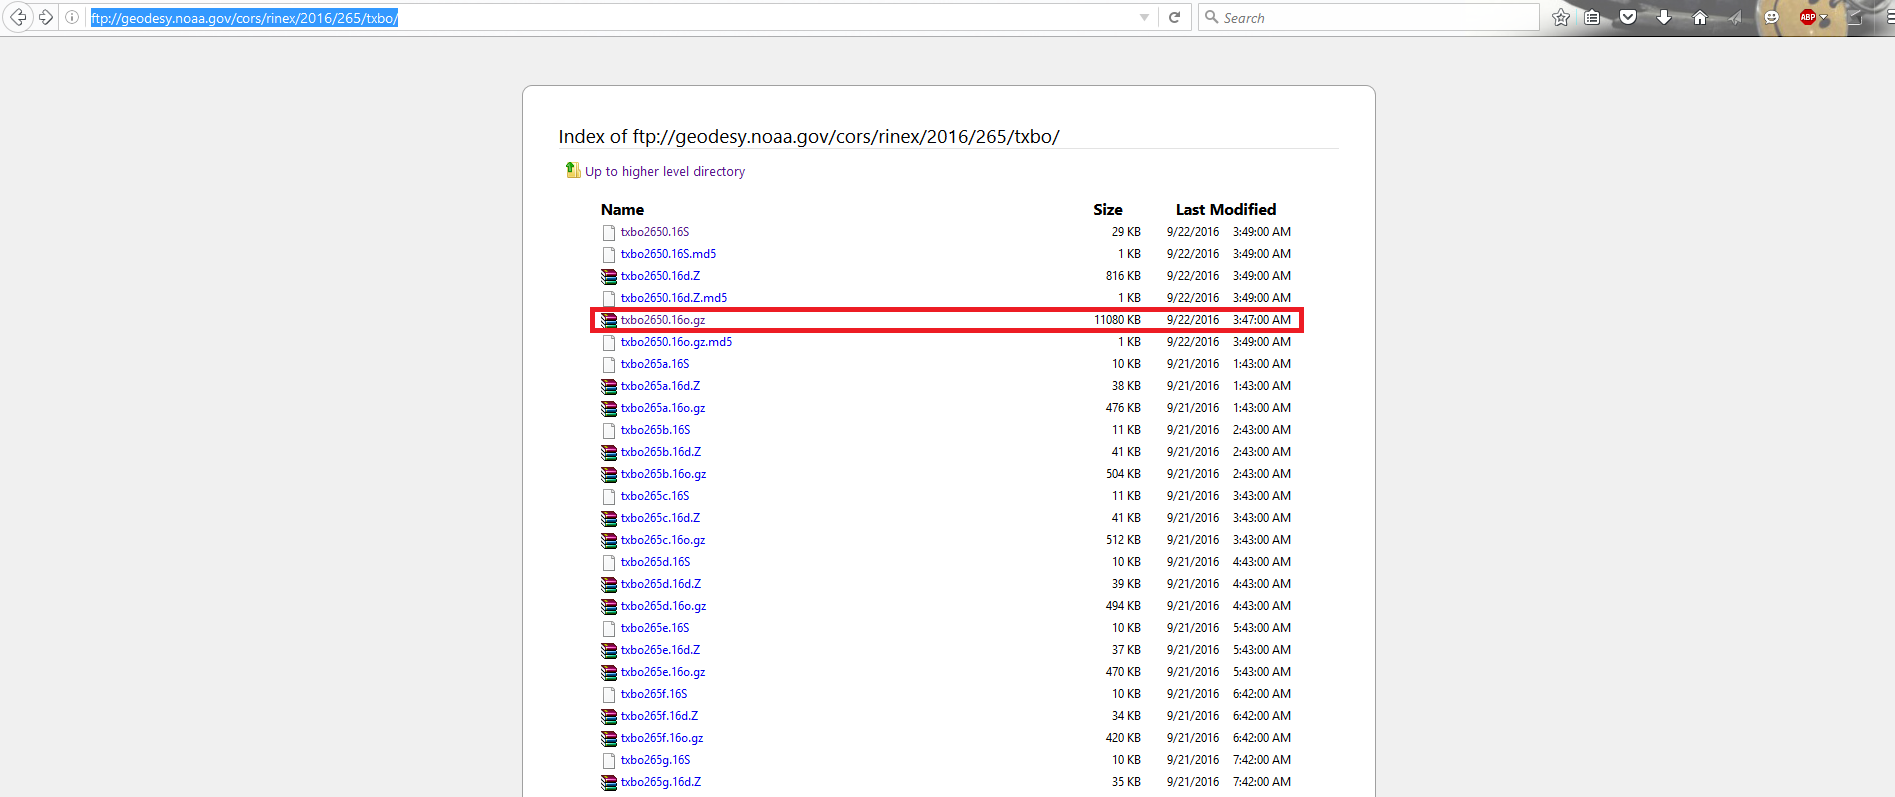
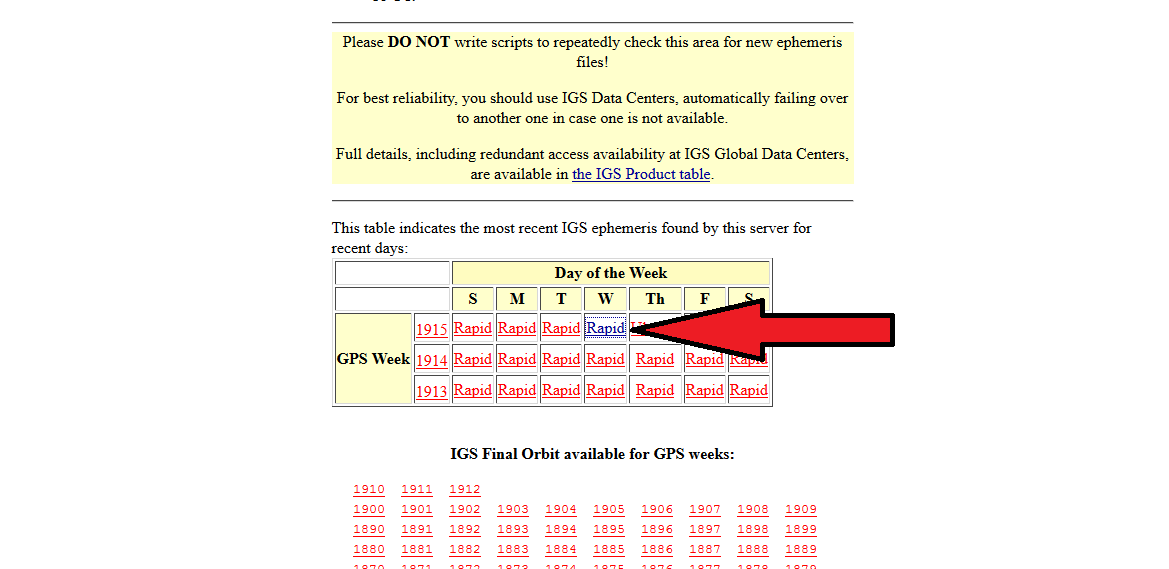
I have also including the IGS clock data for the day and also a CORS reference site with continuously collects data on a single point throughout the day. The CORS site is within 10km of where the data was collected.
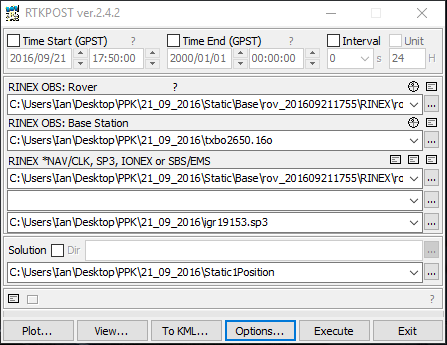
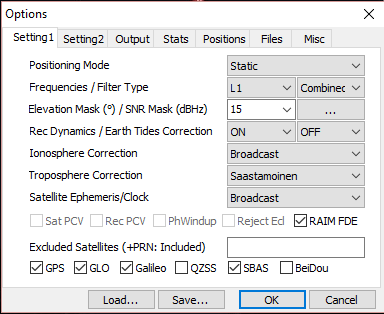
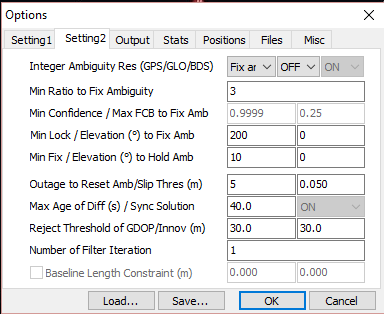
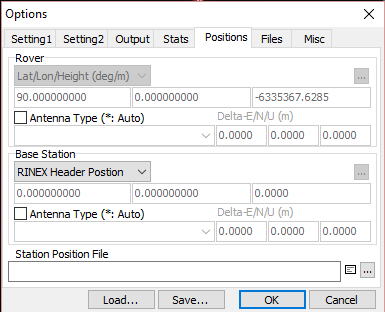
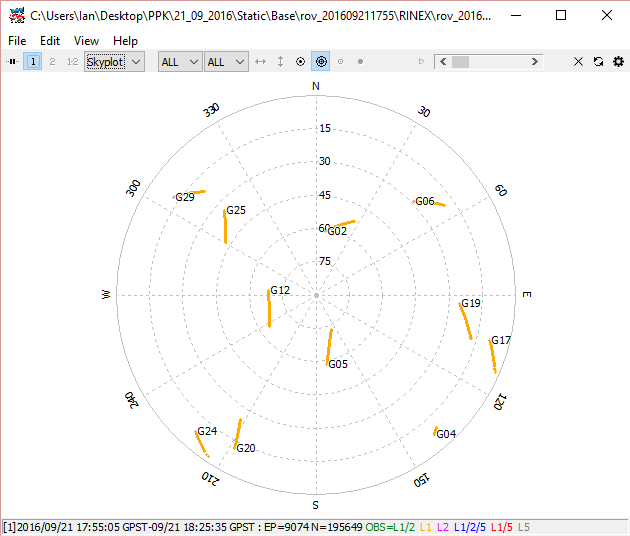
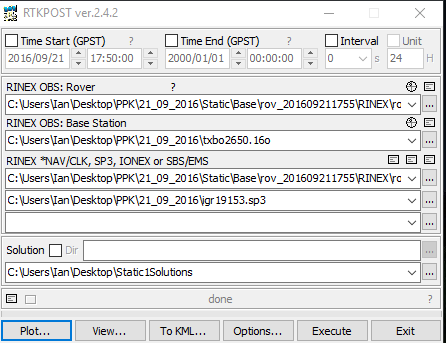
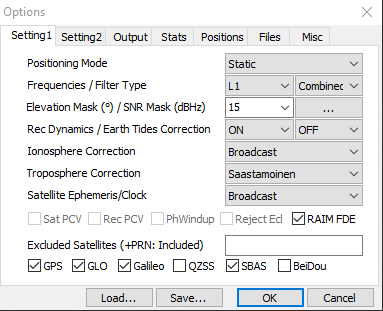
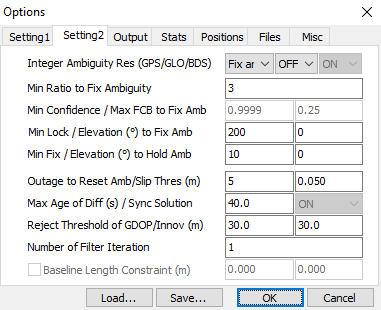
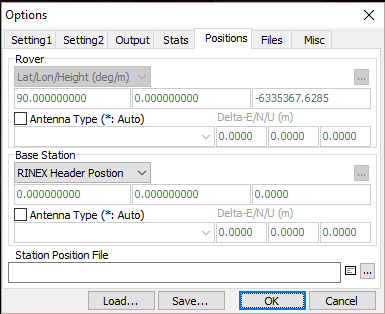
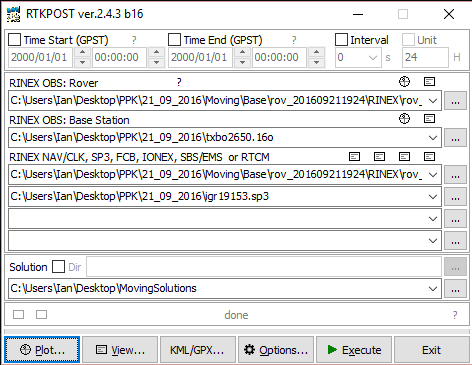
RTKPOST setup.
Not sure where to get the .clk data from that is shown in the processing tutorial. I always end up with a Q=5 position for my Reach Base.
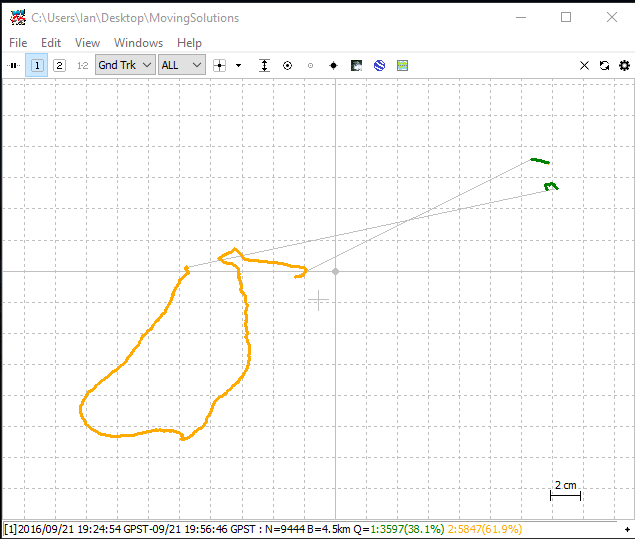
Haha, thats from the moving set of data as I walked the edge of our driveway. I must be missing something really simple. Are all of my fields are correct in the RTKPOST? I know something is there that I am missing. I am using the RTKPOST from the Emlid website with all of the settings from the processing tutorial. Some how I always end up with Q=5. Any ideas on what I could be doing wrong and are you using the same steps in the tutorial. Im not 100% sure I have files in the correct location but the are as shown in the pictures above.
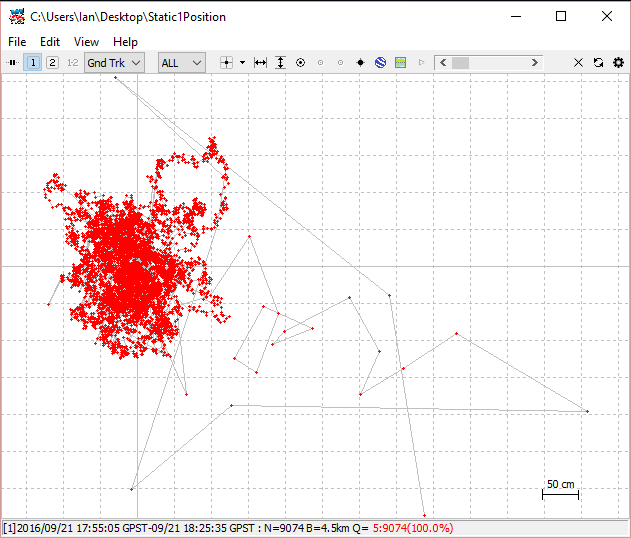
I downloaded it last night. I think my problem is the first part on obtaining a location for the base station. I always end up with Q=5 and a messed up looking plot.
If I can get past the part of obtaining the base location I think I would be set. I see even in the one you posted you get Q=5 but your plot is much nicer looking then mine. Can you show me a screen shot of what your RTKPOST looks like with the files in the correct locations?
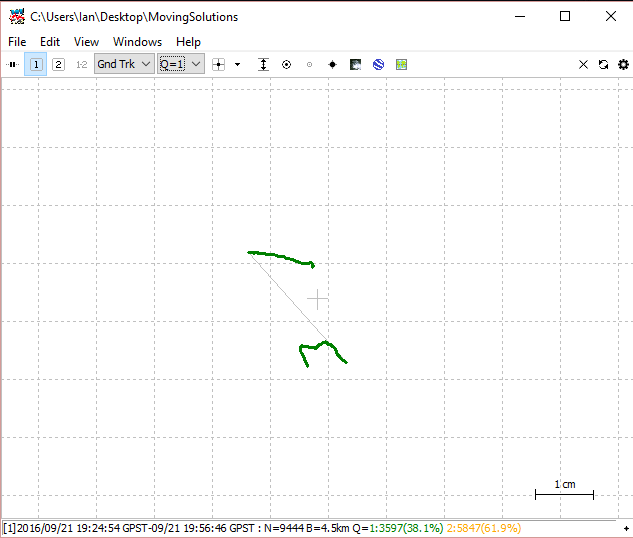
After thinking about it I have another question. How are you getting the average position point from RTKPLOT. After I run the data through RTKPOST in the first set I am just trying to obtain an average position for the Reach Base location. Once I execute the RTKPOST data using the Reach Base compared to the CORS site I get Q=5. What steps are you doing after execution and inside of RTKPLOT to get the data point on the left.
The one you show above has a solution or average point location. I show none of that and am stuck at this point.
Thanks for taking the time to look this over and get back to me by the way. I know you guys are busy over there making the product even better.
Now how do I get a single point from the above data to use in calculating the Reach Rover data. I see on your post you have a single point selected and can just type that into the Positions option on RTKPOST. Did you just arbitrarily pick a point from within the Q=1 points or is this a weighted average of those points?
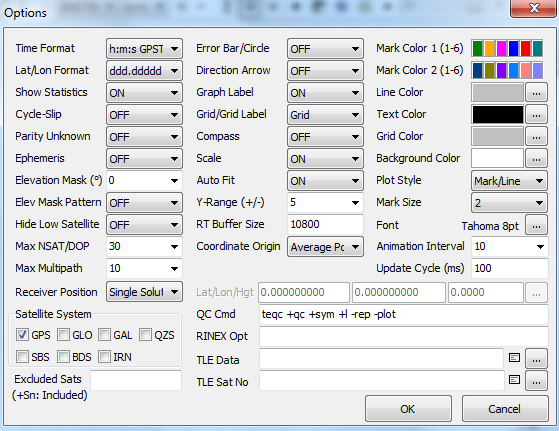
What are the option settings you have selected in RTKPLOT when you open PLOT from RTKPOST. Im pretty sure thats where I am not understanding the point you select for the Reach Base position in the next step.
RTKPLOT options:
I just selected one of the points as they were in a quite tight cluster. Averaging them would be a better way, but ±1 cm was not important for demonstration purposes.
I was thinking the same thing about averaging them. Thanks for the info. We have everything working now and have even been able to pull camera triggers from the rover while on an aircraft. Post processing seems to be the way to go.