My location is Virginia, U.S. I post processing using two CORS stations in
my area: LS02 and UVFM
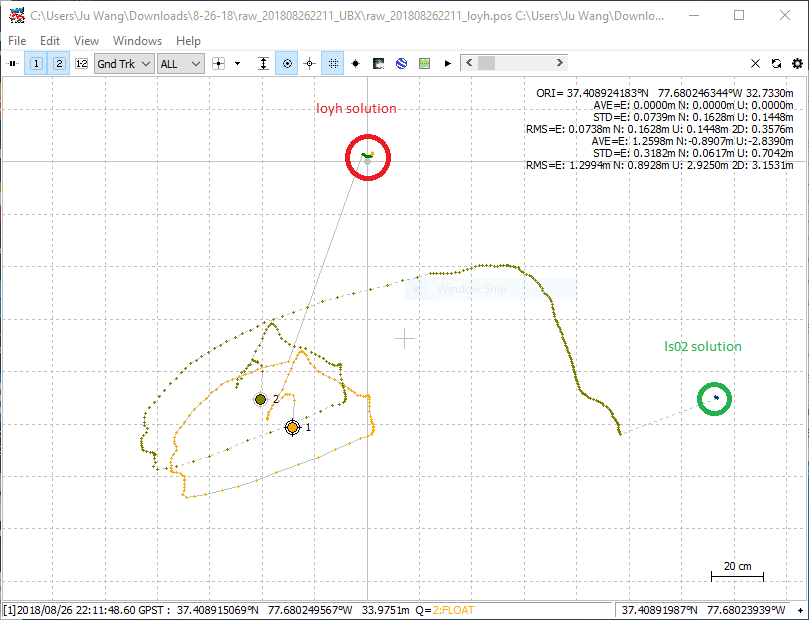
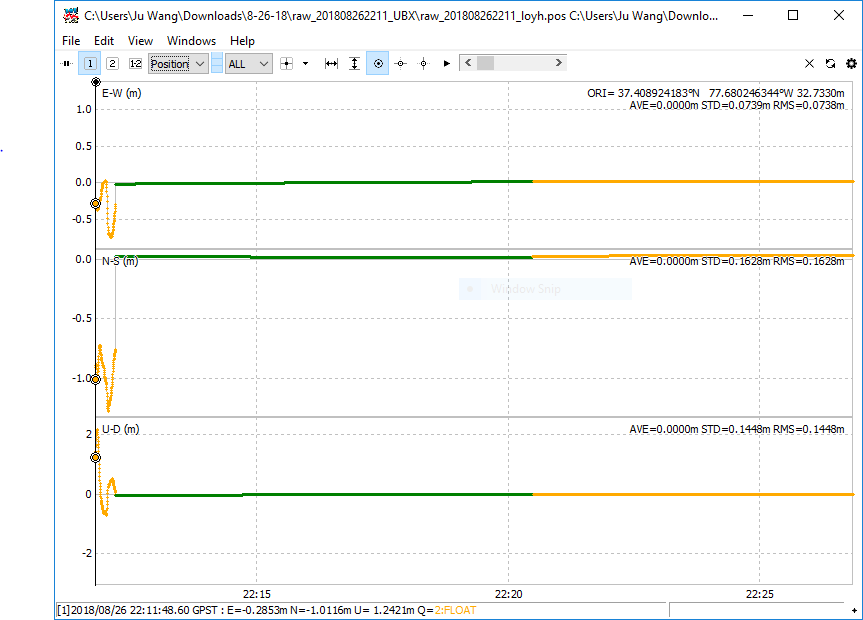
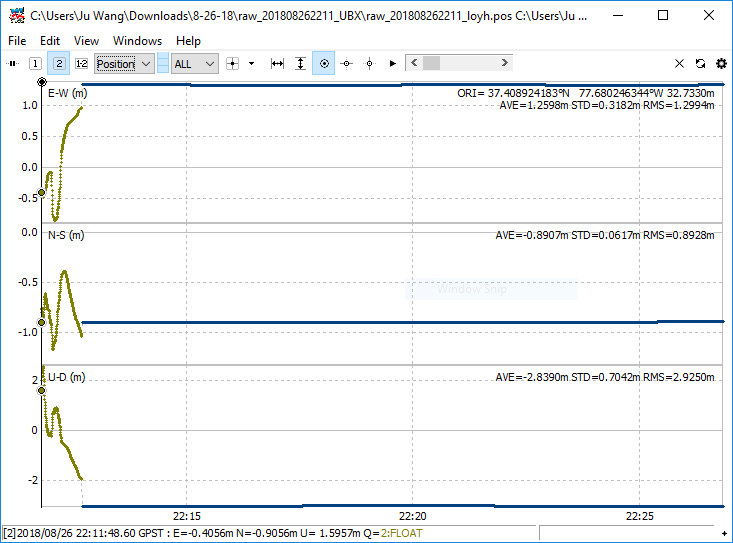
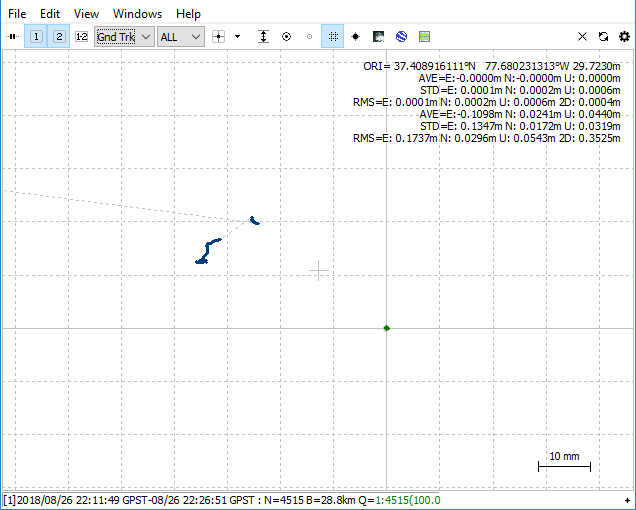
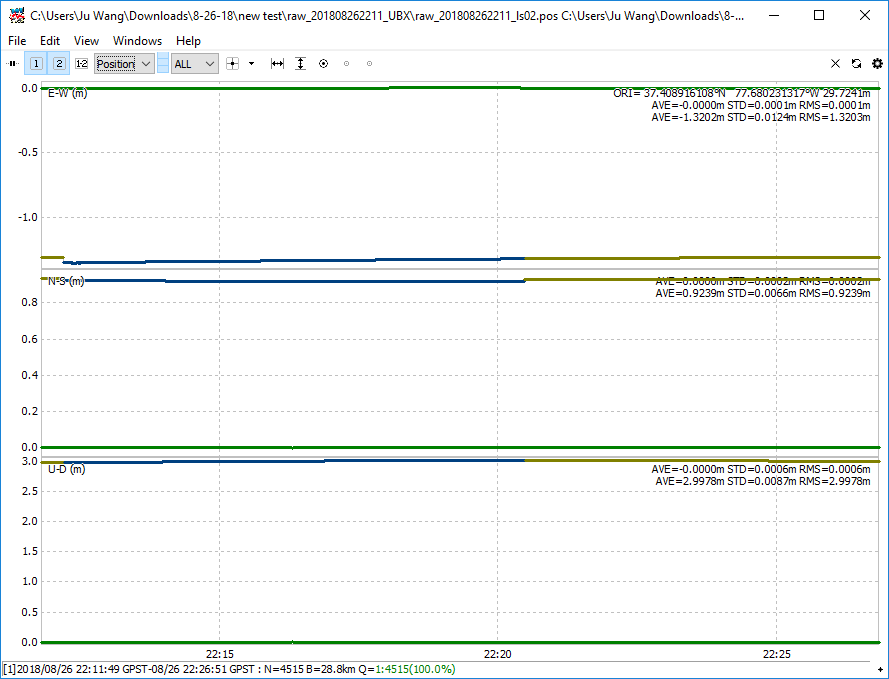
However result of post processing using the above two different CORS stations produce two different solution, about 75cm apart. One station is about 40 km from my rover, and the other 100km. This should not happen since the solution from post process should be within a few cm regardless the CORS station I use, right? I will post some screen shot and raw log data later.
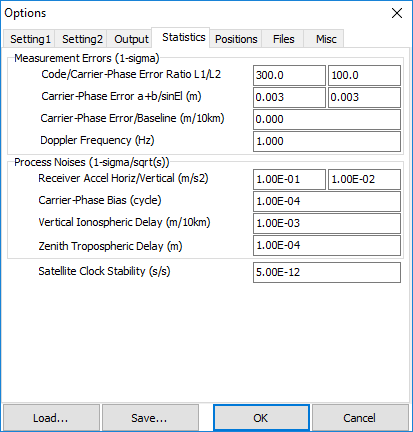
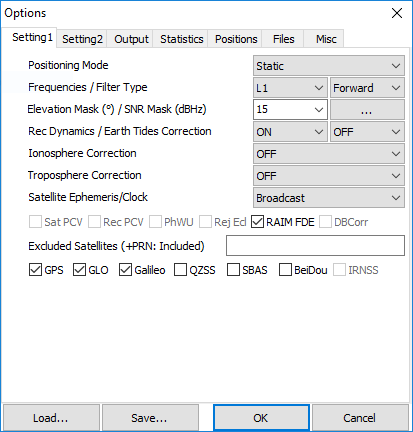
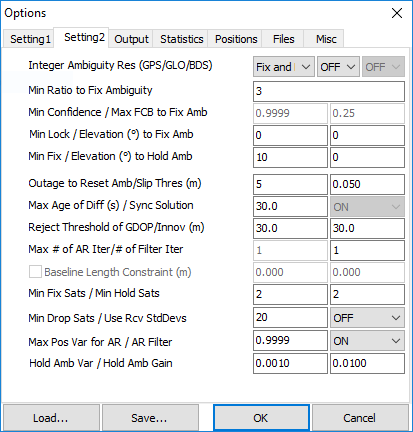
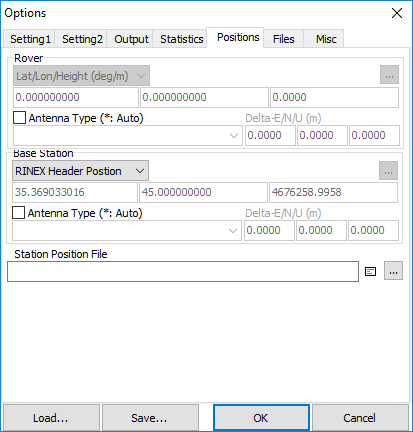
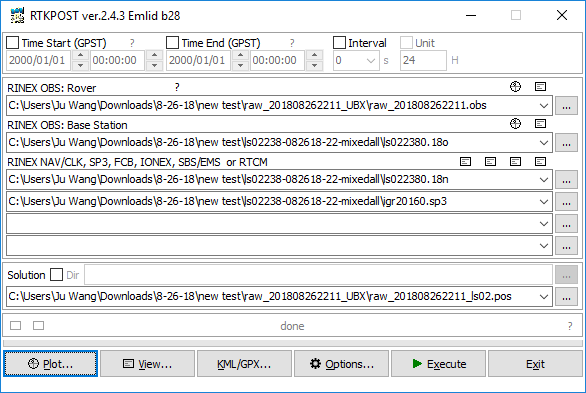
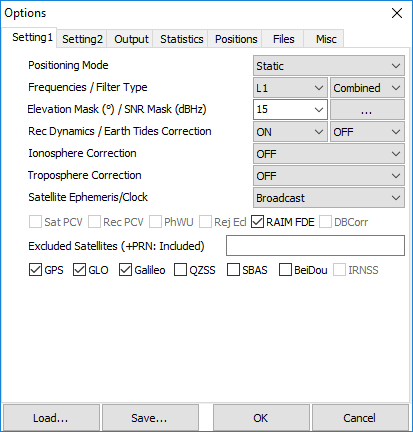
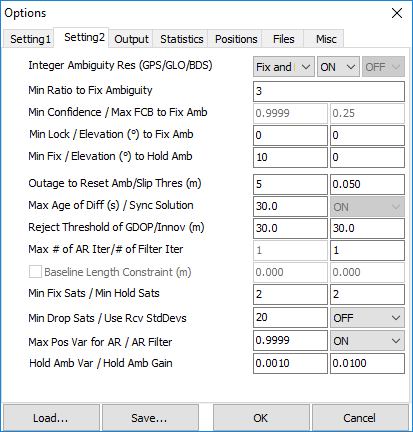
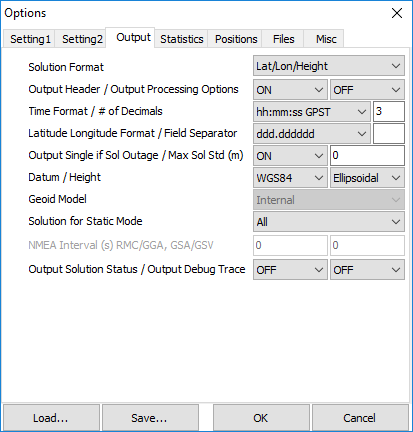
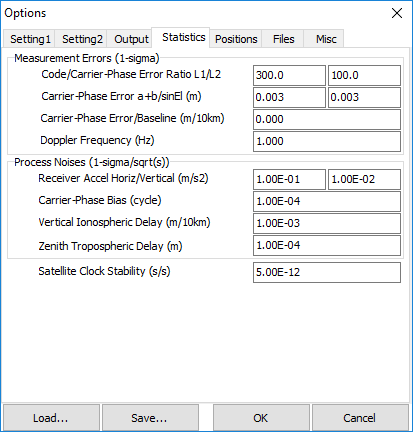
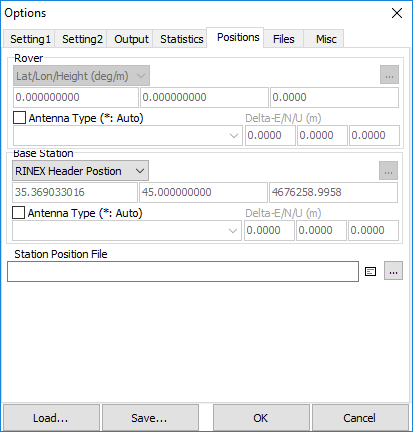
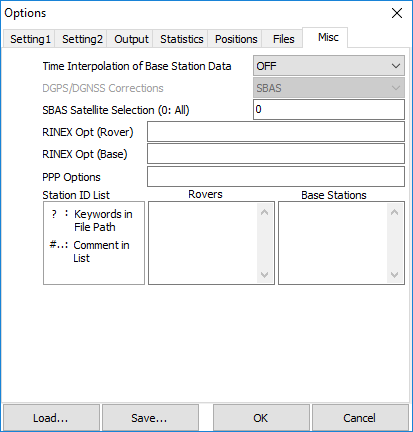
I tried your setting but the results are still far from yours. I posted the complete
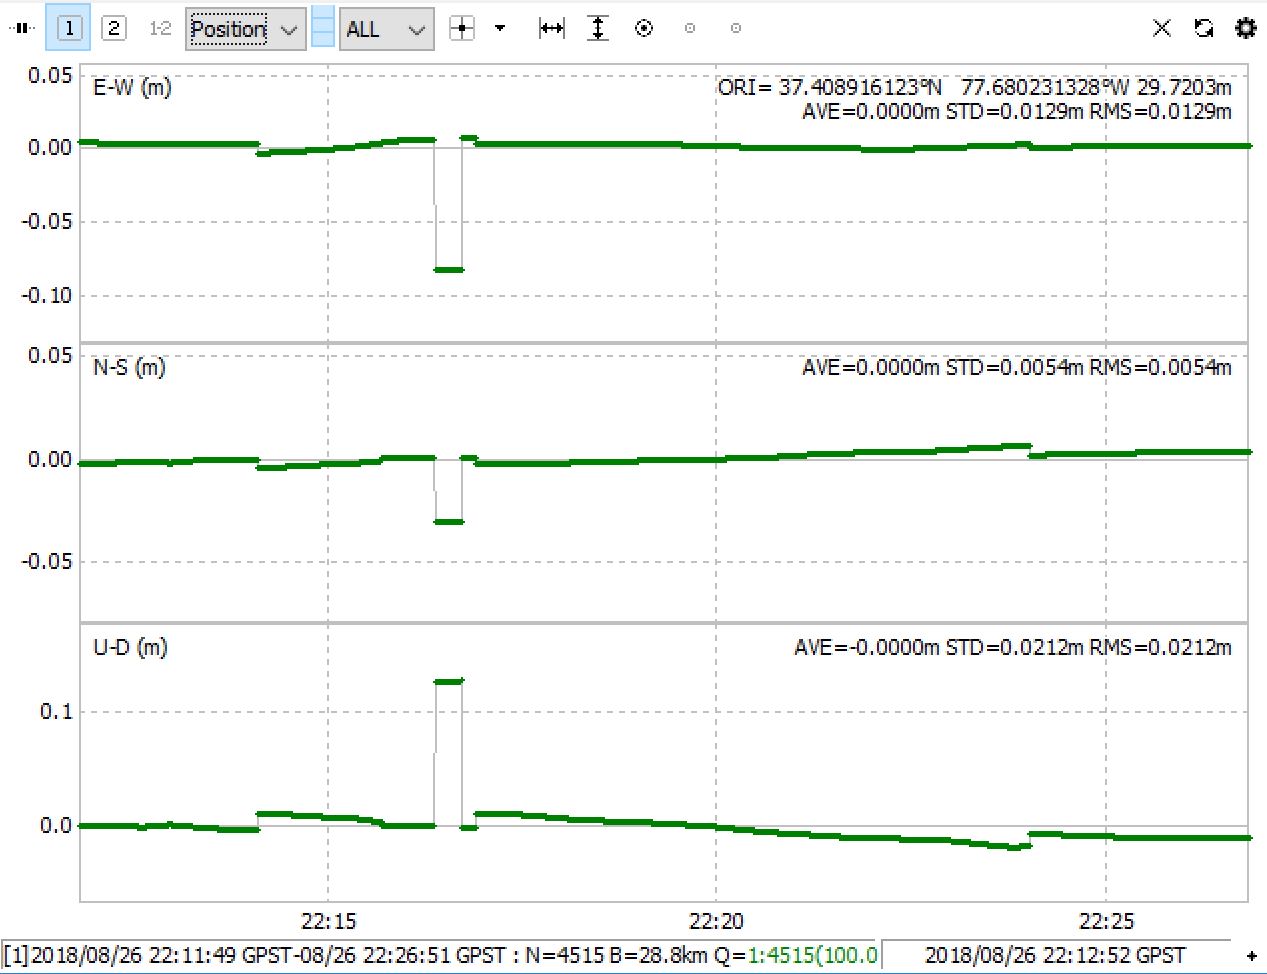
setting here for your examination. The processed .pos data is also uploaded to the
new_test folder in the goggle share.
Other than the option setting, can you also take
a look at the files used in rtkpost? I use converted Reach RS log data at the first field and
the .18o, .18n, and .sp3 files from CORS station at the rest of the field.
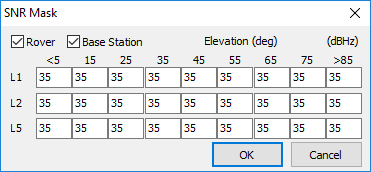
I find that my SNR mask is not checked. I used your SNR mask and obtain the same result as yours. Thanks a lot!
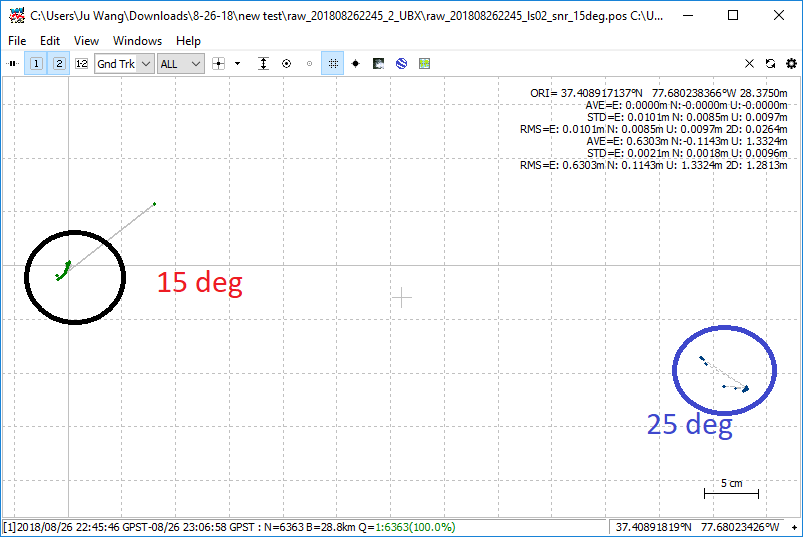
now I have a new question. I have another observation data at a different time. I used the same setting as yours (SNR mask, combined filter etc). The base station LS02 is used (the one that is 30km away). I process it with rtkpost a few times, but with different elevation masks (15, 25, 35 and 40 degree respectively). The solutions are very different from each other. is there a way to tell which solution is better?
Elevation mask allows excluding satellites that placed lower than set angle. The signals from low elevation satellites have poorer quality. We usually recommend using default setting in 15 degrees. In your situation, with the big elevation mask value, RTKLib doesn’t include “good satellites” during post-processing.
To add to that, if you are in an area with good sky view all around, no buildings and so, no reason to use a mask of more than 15 degrees.
In case you are close to buildings, trees, etc, and they fill up a lot of your sky view, 20-25 could be better, to avoid a lot of multipath and general noise.
As general advice, play with the settings using data where you know the absolute position in 3D. That makes it easy to decipher the different settings.
Also notice that different recording-conditions might require different processing settings. There is no one-size fits all, sadly.
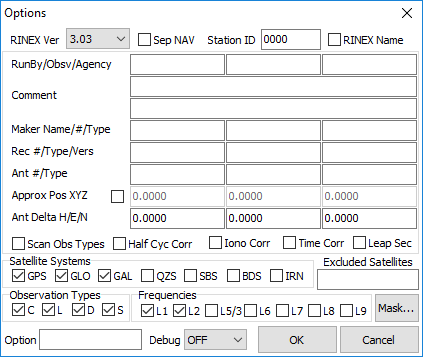
a little off topic, but a little help about the RINEX format. here is a snipple of the observation
data:
7 C1 L1 S1 P2 L2 S2 C2 # / TYPES OF OBSERV
1.0000 INTERVAL
teqc.w windowed: start @ 2018 Aug 26 22:00:00.000 COMMENT
teqc.w windowed: end @ 2018 Aug 27 00:00:00.000 COMMENT
2018 8 26 22 0 0.0000000 GPS TIME OF FIRST OBS
18 LEAP SECONDS
END OF HEADER
18 8 26 22 0 0.0000000 0 16G02G05G13G15G20G21G24G29G30R03R04R13
R14R18R19R20 24265945.740 127518397.310 5 36.300 24265937.020 99364951.99544 34.250 23084814.460 121311512.932 8 47.100 23084807.360 94528425.51845 37.550 23084808.460
21083944.660 110796874.733 8 48.650 21083937.000 86335198.68746
41.200
…
the two bold lines I am guessing are the observation for G02 and G05 respectively. what is the meaning of these data field and why G05 has one more data field than G02?
sorry for being lazy I know the answer must be somewhere in the RINEX document.