I extracted all the raw files from both the rover and base station, together with the project files from the rover that contain the point observations i’m interested in. I was thinking to post-process these point observations with the known coordinates of the base-station (X, Y, Z base: 696647.529, 652304.351, 1.408 in XYZ in UTM WGS 84 projection).
link: https://drive.google.com/drive/folders/1N-zv5SSDQMXUuMmRV6FTV08QxorVBzOy?usp=sharing
I assumed that going through these steps would result in post-processed observations of my ground control points. Unfortunately I’m not sure where to go as soon I have the processed (I assume) in the emlid viewer.
Appreciate any help on the post-processing or at least where to find some extra information!
You’ve got solution files after post-processing. Now you can check the coordinates of the collected points using these files.
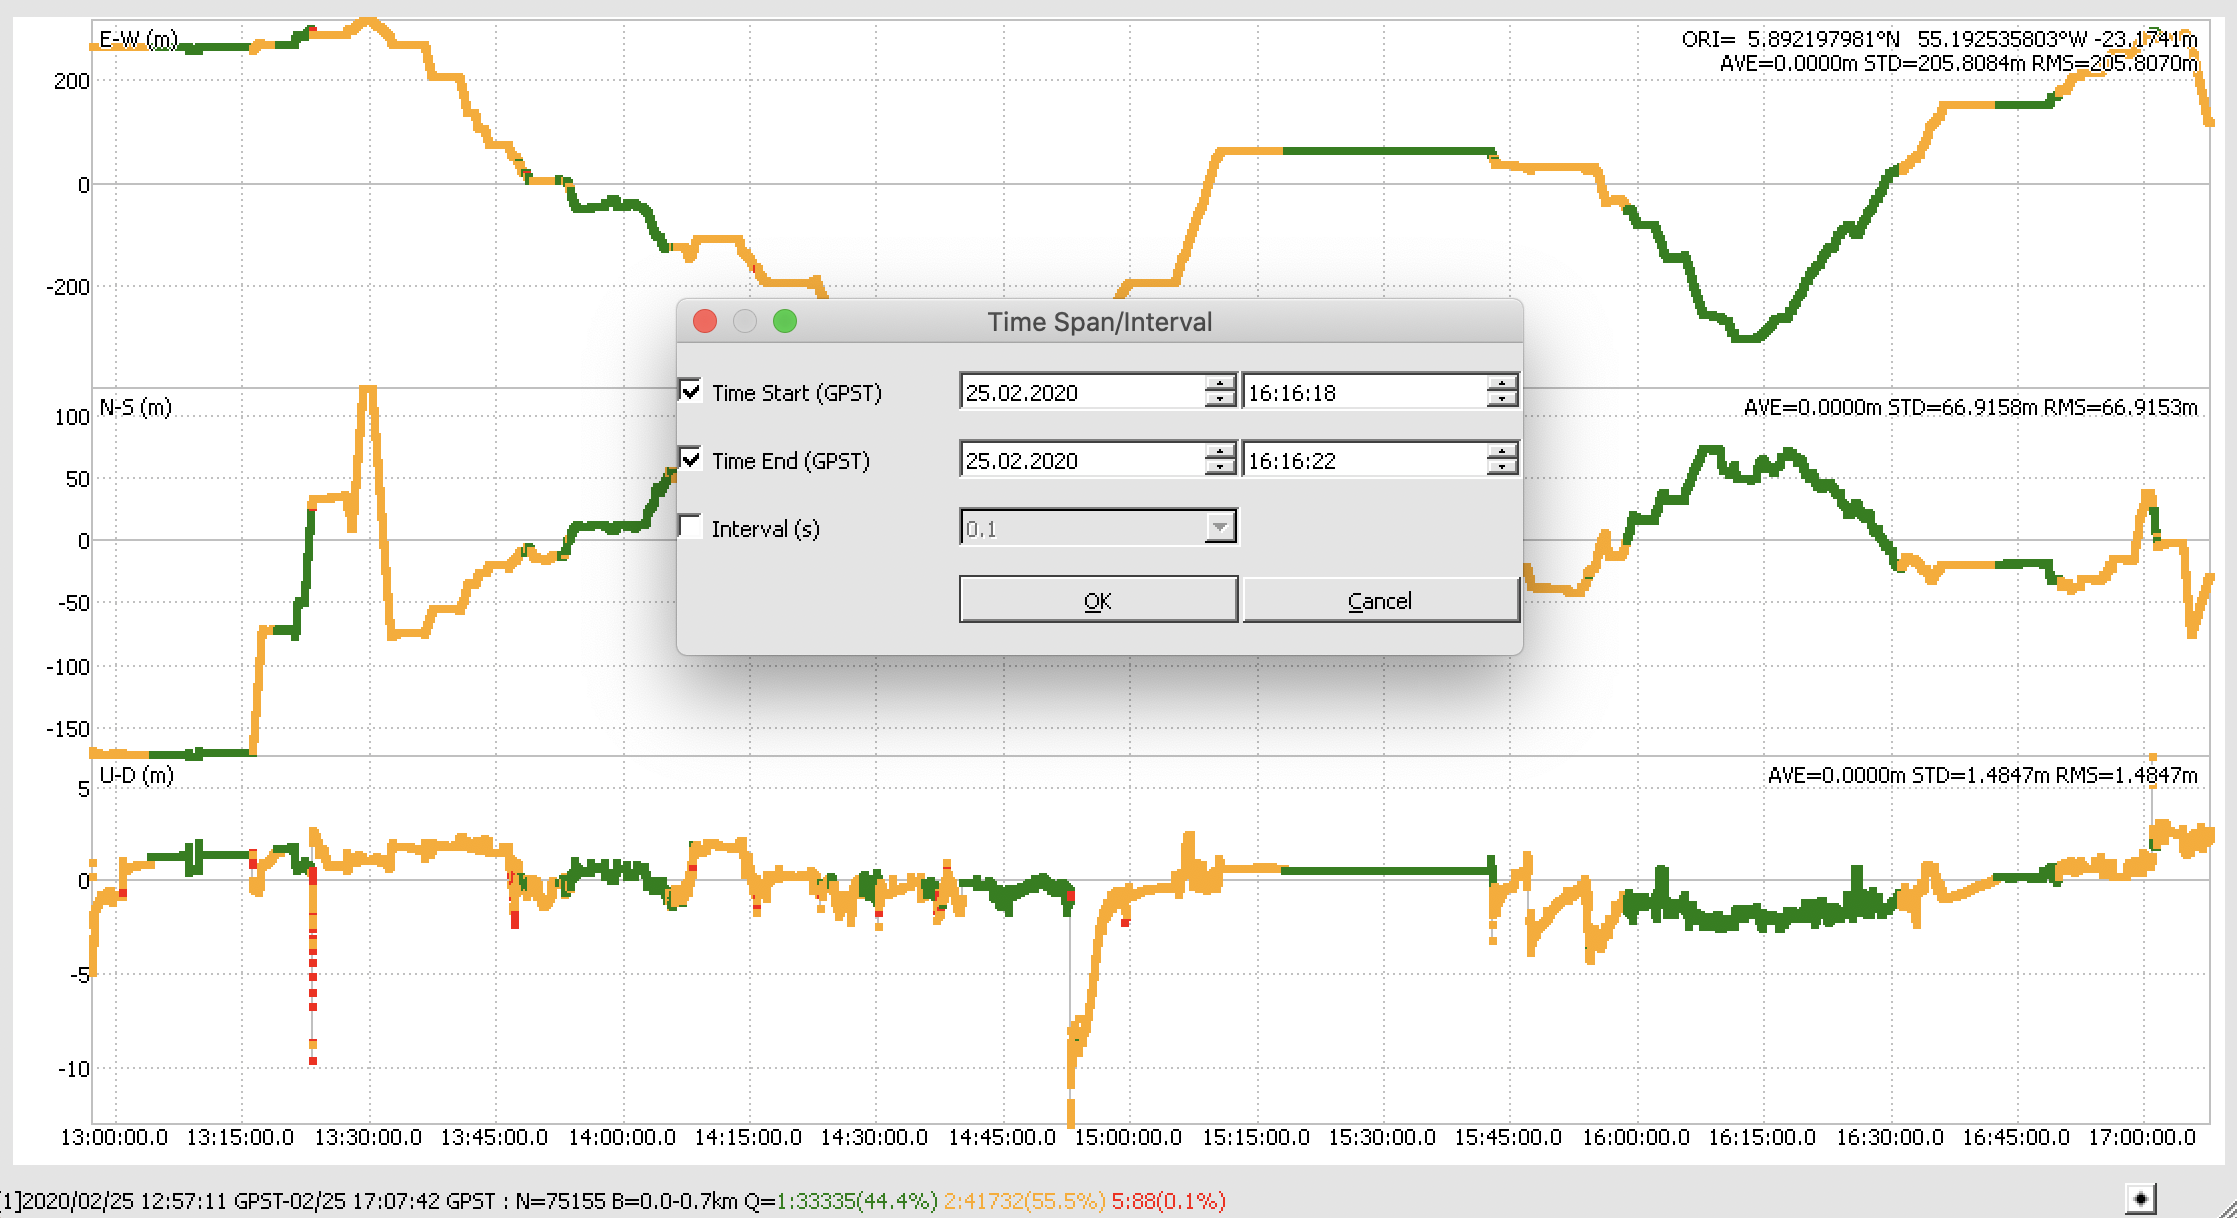
To check the averaged coordinates of a collected point, you need to set the time of the point collection in the RTKPlot. To do that, go to Edit → Time Span/Interval and set the start and the end time of the desired point collection. You can check the collection time in the CSV file. Please note that time in CSV file is in UTC format, while RTKlib works with GPST format. GPST is 18 seconds ahead of UTC.
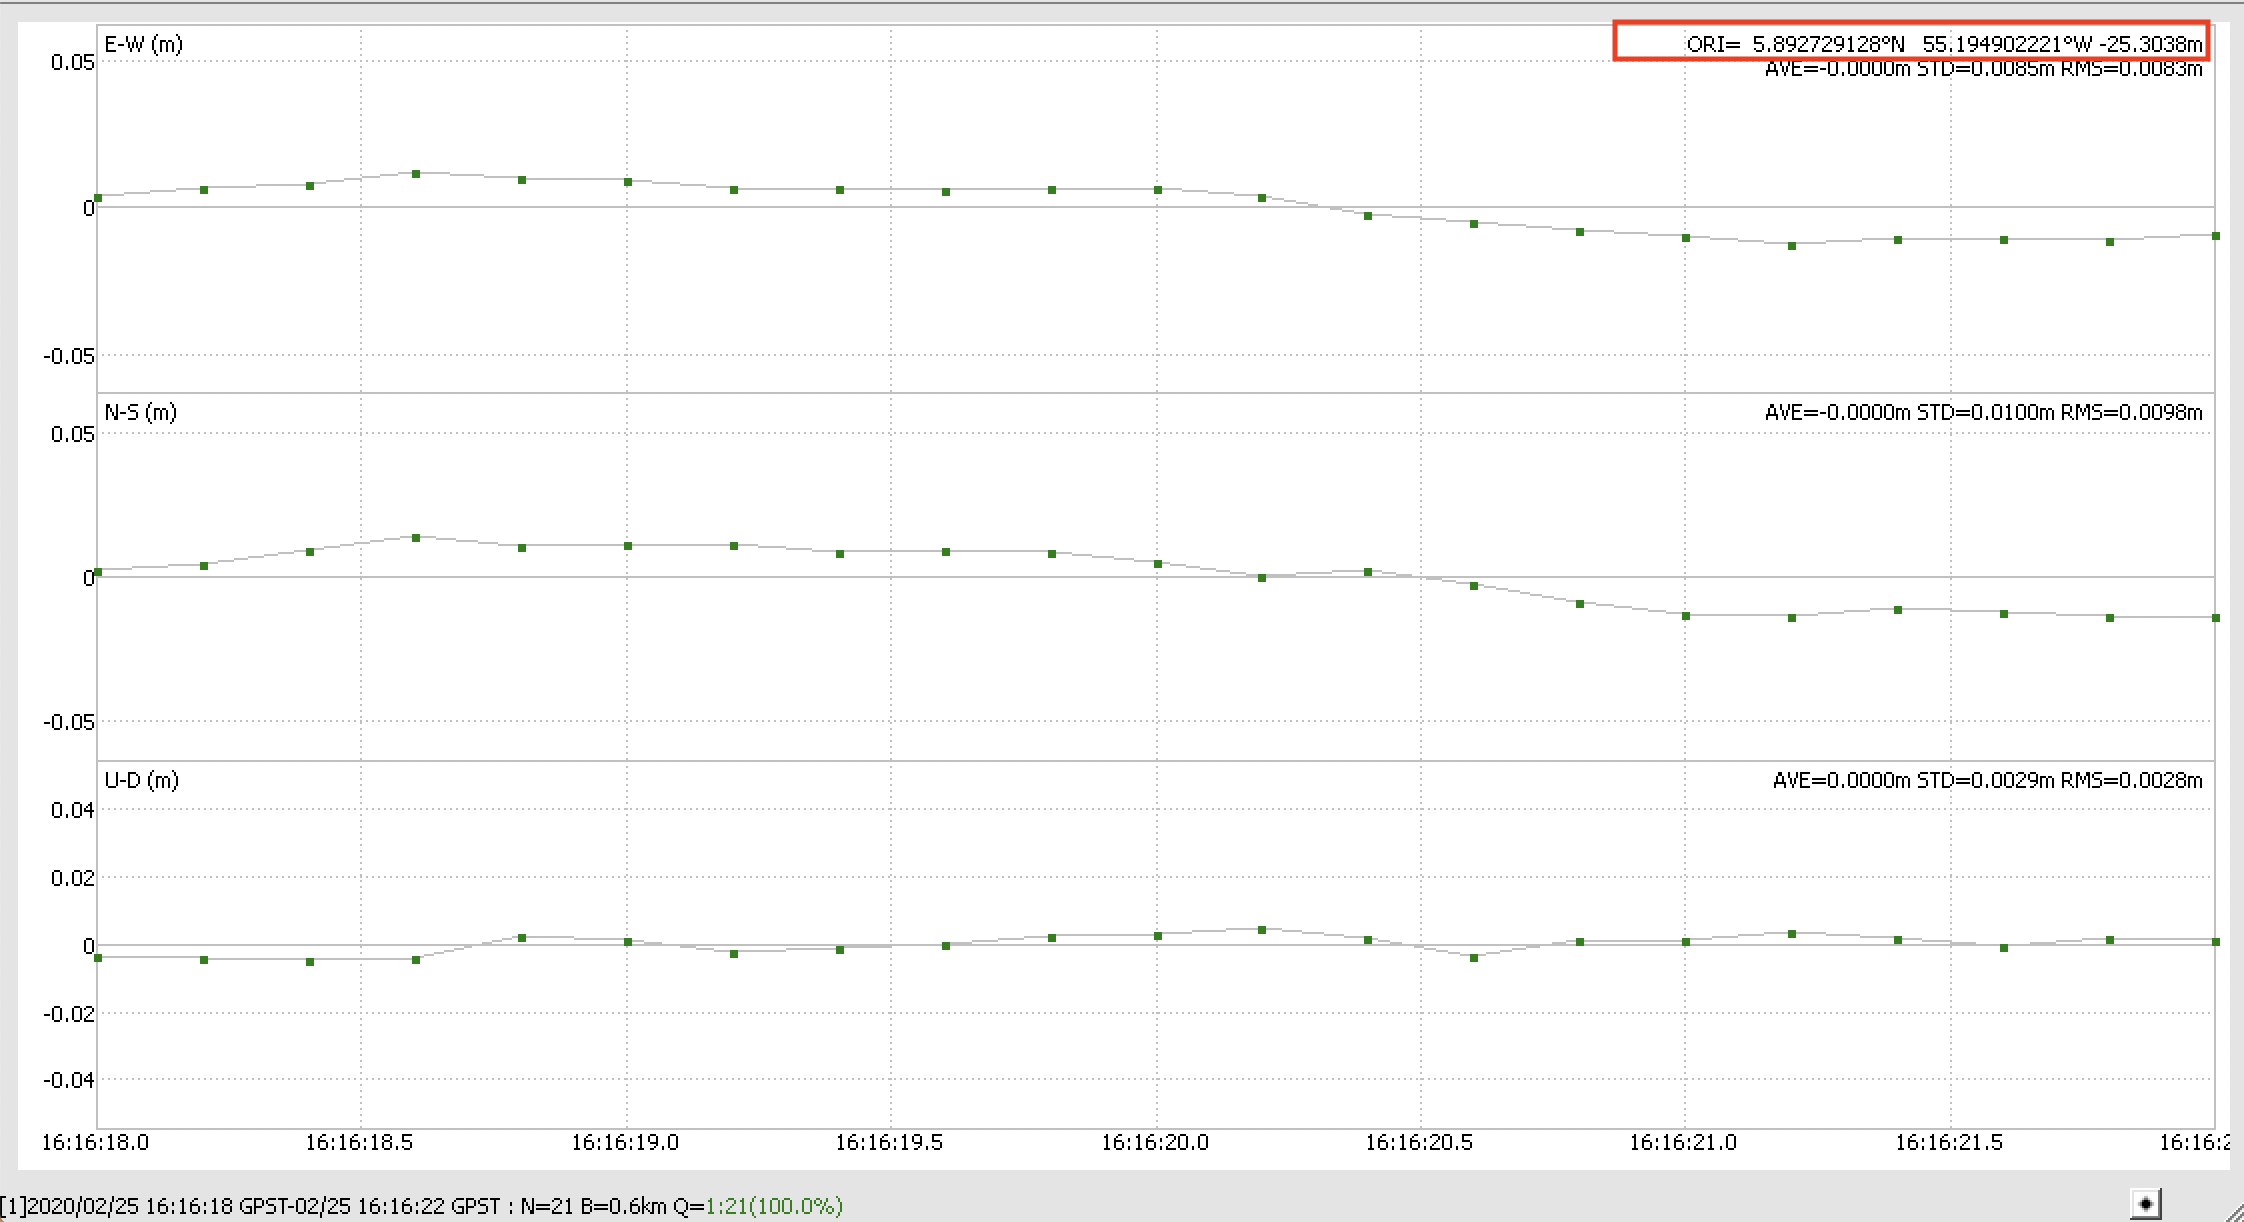
When you open the solution file in RTKPlot, there is an ORI parameter in the top right corner of the window of the Position tab. This parameter shows the averaged coordinate of the point.
I’ve post-processed your files and chose the Point 16 from the WnZ natural 202002 validation.csv file. You can see it on the screenshot. The position is specified in the red frame.
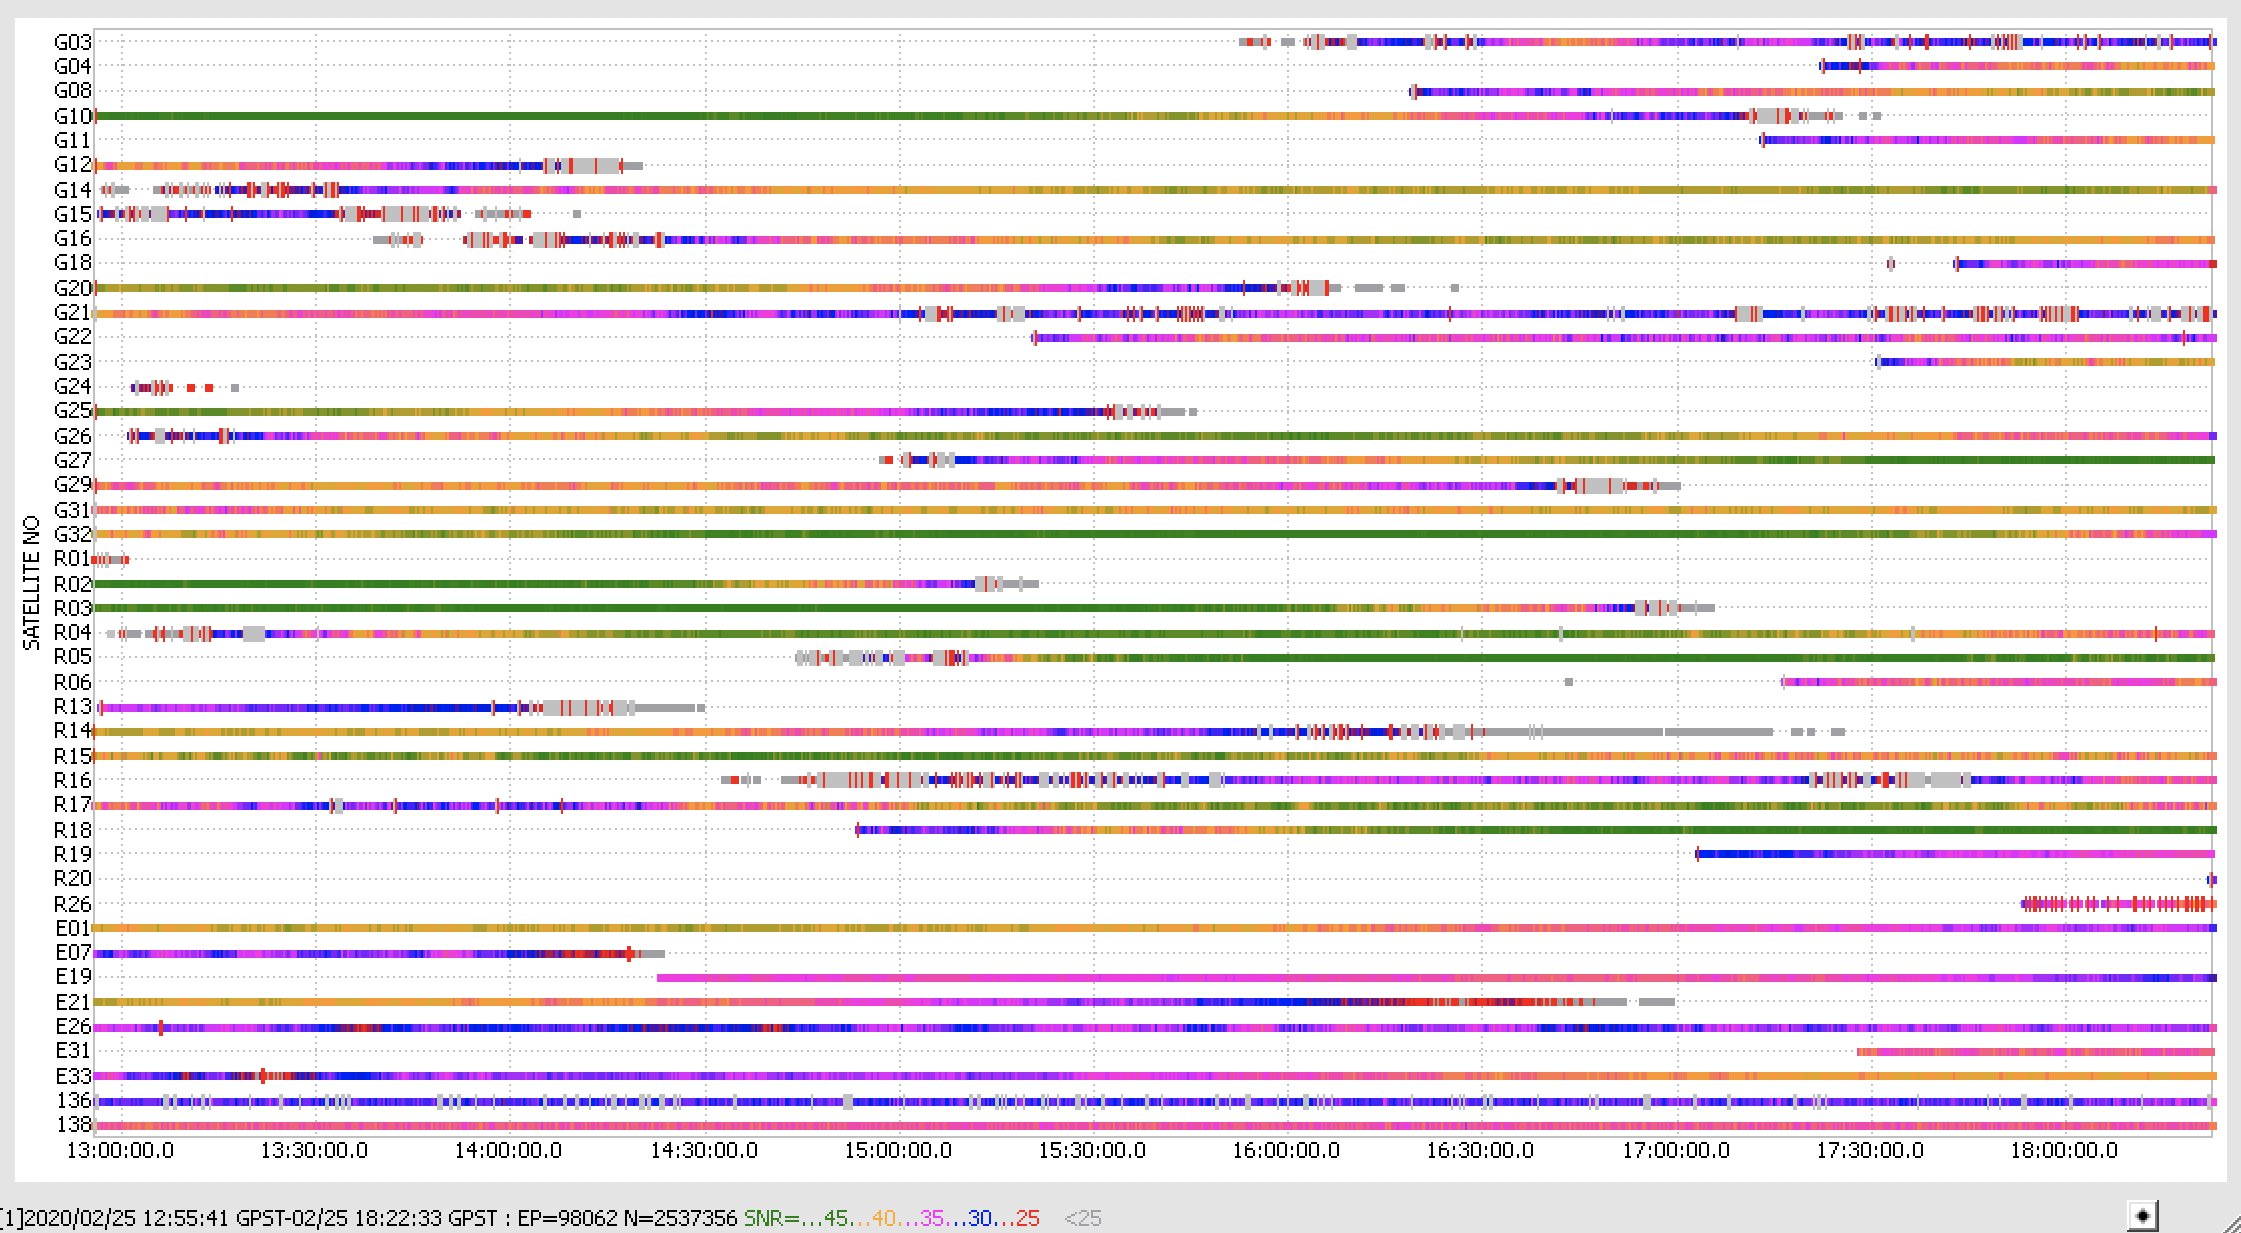
Also, I’ve checked your observational data files. The results contain many red marks: they are called the cycle slips. A cycle slip appears when the signal was delayed or disrupted, and Reach lost track of the satellite. The big amount of cycle slips can result from improper setup. It can also cause difficulties in PPK. You can check our guide to learn how you can improve observational data.