Hi I have a question about accuracy and precision in post-processing.
I’m trying to set up a base station reference using CORS data. As a test I logged data for 35 mins or so and ran it through static processing in Emlid studio with data from a station 25-km away. It resulted in 1 fixed position and I am happy with the results.
My question is that I didn’t see any estimated accuracy or precision in Emlid Studio. When using the Reach Flow app it produces real time estimates, and if I export a csv file for logged points I also have values reported. How do I evaluate the accuracy of my benchmark?
Similarly does the post-kinematic processing in Emlid studio report any values?
Hi, you should have access to RMS values in the output .pos file from Emlid Studio.
To have a more robust estimation, I recommend doing the baseline process from several bases - if possible of course - and analyze the distribution of the results. Mostly to avoid the case where the coordinates of the CORS you used are wrong.
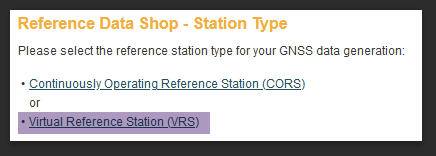
@mfmaddox If the CORS data downloaded and used for post processing is part of your state’s DOT RTN, you might, depending on the DOT’s RTN’s software, be able to elect to use a VRS (virtual reference station). Normally, when doing RTK with corrections from an RTN, and the chosen mount point is a VRS, the VRS location is chosen automatically, transparently to the user. But when you’re doing post processing, you can arbitrarily determine the VRS location yourself and make the baseline <100m from your project.
As far as I’m aware of, Emlid Studio only allows a single baseline to be processed, for example, using only a single CORS. Naturally, selecting the closest CORS makes sense. The VRS, on the other hand, is derived from multiple CORS. Check with your state’s DOT. Welcome to the Emlid forum!
ES will process a point observation using a VRS obs log. I will have to look at the log to see how baselines are estimated. But I know it lists multiple CORS stations that were used to build the log.
Thank you all for the feedback. By output .pos file do you mean opening it as a text file? Thanks for the suggestion I see what look like RMS values for E, N, and U, what I needed.
What do these additional values mean, sdne(m) sdeu(m) sdun(m).
I’ll look into the VRS solution as well. Thanks again.
@Florian
Yes, as far as I’m aware of, the state department of transportation allows for GNSS data and the RTN service itself for free. But I don’t get out much. It may not be true in every state. I’m in Maine, but have played around in other places a little bit (FDOT), none of which have I found there to be a charge.
Trimble is actually the software developer, and its Pivot Web Application is what MeDOT uses.
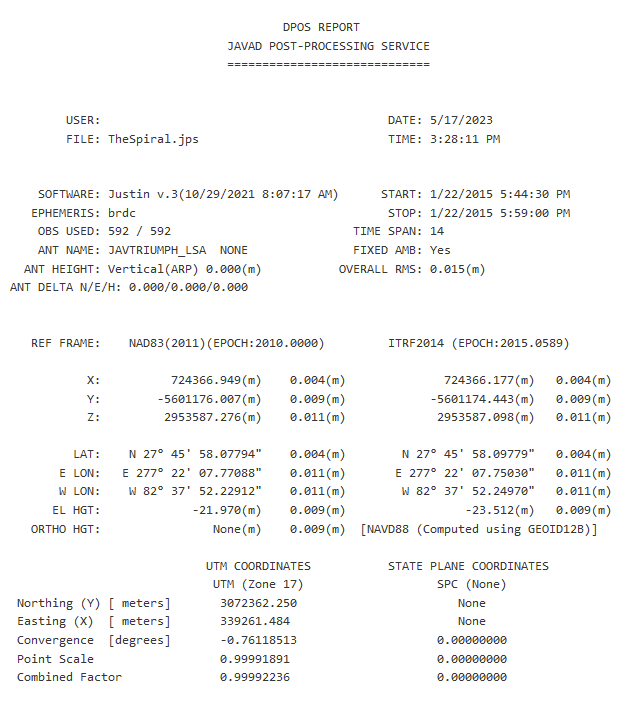
I placed a Javad receiver at Dali’s Heart and used the FDOT’s data from multiple CORS for processing, but that was 8 years ago and I don’t think downloading a VRS was an option then.
@dpitman
Hi Dave,
The VRS is determined by the RTN’s software based upon multiple CORS. Emlid Studio then processes a single baseline from it for your project. I don’t believe that Emlid Studio allows multiple CORS stations data to be simultaneously processed.
@mfmaddox
Yes, open the .pos, either in a text editor or a spreadsheet; e.g., LibreOffice Calc
If you process All solutions in Emlid Studio, Settings, Output solution, All solutions, you’ll see the stats for each epoch collected. manual_2.4.2.pdf (5.8 MB)
Standard deviations are discussed in the attached manual_RTKLIB v2.4.2.pdf
Pos file contains sdn, sde, sdu, and sdne, sdeu, and sdun columns.
The sdn, sde, sdu means N (north), E (east), or U (up) component of the standard deviations in meters.
The sdne, sdeu, and sdun are square roots of the absolute value of the NE, EU, or UN component of the estimated covariance matrix.
Standard deviation isn’t the same statistics as RMS (root mean square). Standard deviation is used to measure the spread of data around the mean, while RMS is used to measure the distance between predicted and actual values.