Yesterday I logged Static data for 3 hours. This morning I uploaded to OPUS and got a message back saying the data is too noisy to process. This is the second time in row this has happened.
I am not sure what I’m doing wrong? The receiver was set to all satellite systems and full rate interval. It was placed in a wide open space with no obstructions to the sky. It was facing north and I waited a good 4+ minutes to let it warm up before hitting record. It was stationary the entire time, although the wind was blowing up to 15-25mph during most of the logging session.
The receiver has never been dropped or banged so it hasn’t been damaged.
I would like to learn how to diagnose and trim my logs. Can I do this in Emlid Studio?
I tried attaching the observation file to this post, but I got a message saying it wasn’t an approved file type.
I was able to use Static Processing in Emlid Studio to create a known point but it only has Float level accuracy.
I tried posting the .23O file and the UBX file on here, but apparently they’re not approved file types for uploading.
In any case, I finally did get a solution from OPUS after submitting the .23O file three times. Perhaps I just didn’t wait long enough for the CORS data to be ready? It took about 17 hours and three tries to get the solution. The first submission was about 14 hours after finishing the logging session. The second submission was about 16 hours afterwards.
Yep, that could be the reason. We recommend uploading the data the next day after the survey. Some OPUS stations provide data daily. So it’ll help you ensure that it’s used in calculations.
What are the results of processing the data in OPUS? Did you get good results?
Just wanted to add that OPUS calculates the solution using only GPS observations. So there is no need to record the data from the rest of the constellations. You can also reduce the logging interval to 30 seconds. It’ll help you record a file with acceptable weight for lengthy observations.
@julia.shestakova I eventually got a solution email from OPUS. I don’t really know how to evaluate the quality of the results. I just ran with the solution they sent me. I will use the OPUS preset when logging for OPUS in the future. Thank You!
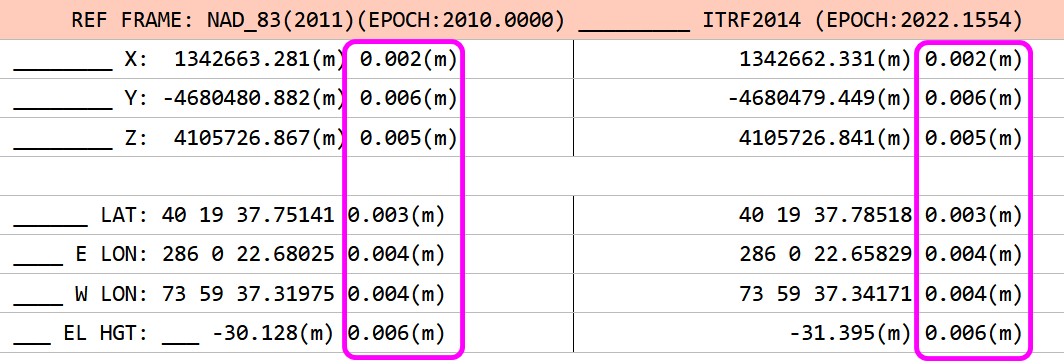
Hi Bryan, is the value after each coordinate the calculated RMS for that particular coordinate (see screenshot from opus instruction page)? I tried my first OPUS point and the overall RMS is 2cm (.021m) but the individual RMS, if that is what they are, range much higher, 5cm up to a whopping 42cm on Lon. I don’t see how the overall could be stated as being that low with some parameters being so high? The % of observations used on this point is low as well, 55%. 72% of ambiguities fixed.
Thanks!
I usually use the extended report as that also has the baseline error from static point to all the CORS. That’s your best indicator of good data.
I don’t see anything wrong with your data, however to have a confident position make sure at least 90% of your observations are used, you would want at least 50% of the ambiguities “fixed”, overall RMS is < 3cm and peak to peak errors less than 5cm.
To feel confident in your position, I would run again using the extended report and look at the baseline errors. If anything is above 3-5cm, that’s not a good baseline, irregardless of the position accuracy of the computed point. It increases the error of your position using the bad baseline
If you can, try and use different CORS, but keep your baselines short if at all possible .
Here’s an example of the Javad “DPOS” extended report on a project we’re working on now. The Javad DPOS processor can only be determined by using Javad files/receivers, however it’s a mirror format to NGS OPUS. You can see the highlighted area of the baseline errors (we use “ift” in SC). This would look the same in the extended NGS OPUS report.
I’ll try to dig in and decipher what to look for. If the report says that 55% of obs. were used on a 6 hour observation, it’s game over, correct? Is there any benefit of trying a longer obs. or, the environment at that point is probably not going to work out?
How long was the observation ? If you feel comfortable with the current position I’d go ahead and use. But to verify baseline accuracy, go ahead and resubmit. You might be surprised how accurate it is. Usually for NGS OPUS, I use minimum 1 hour observation and use the rapid static processor depending on baseline length. Seems like you get a faster response from OPUS using rapid vs static processor.
I’ve used 15min with our Javad machines for OPUS and have gotten excellent results on 30km baselines. This was part of a GNSS traverse loop. Accuracy was 2-3cm both H/V. Emlid receivers were about the same. This was also verified with Javad Justin 3 software.
Oh, I’ve been meaning to PM you concerning my first project in Metashape. Pretty neat software.