Need help to increase accuracy

I just have post processed my observation. RMS Error is high, maybe it is because float result. How to cut only Q1 just plot in result?
@mikhail.avkhimenia, @igor.vereninov, @egor.fedorov

These are the rover and base file

Rover
https://drive.google.com/file/d/0B4NFPYGvPmMvVHZYbkJNUHljNU0/view

Base (-7.706994100,110.347461700,260.3530)
https://drive.google.com/file/d/0B4NFPYGvPmMvRE1rUzV3dngzUGM/view

If you want to only plot the fixed part of the track, you can configure that in the menu hiding behind a small gear on the upper right.

There are two RMS and STD with difference result, which one show the accuracy of the point?
@egor.fedorov

Left pict Q=1, Right pict Q = all

And the all coordinates are averaged, then the final coordinate is not look like fix. Red arrow point to result coordinate.

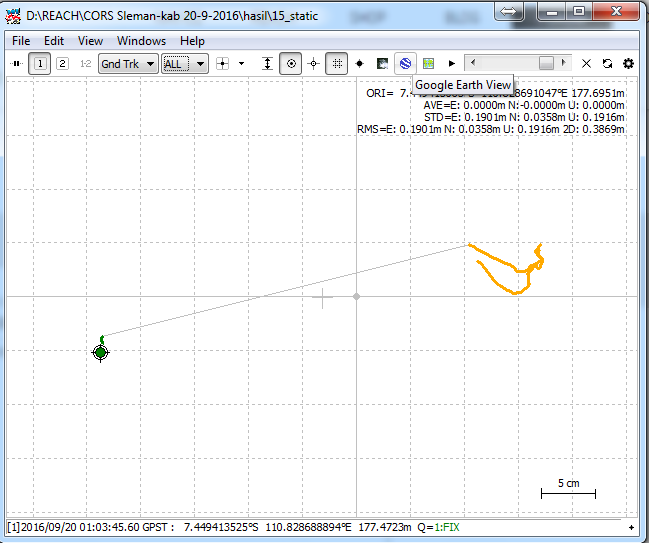
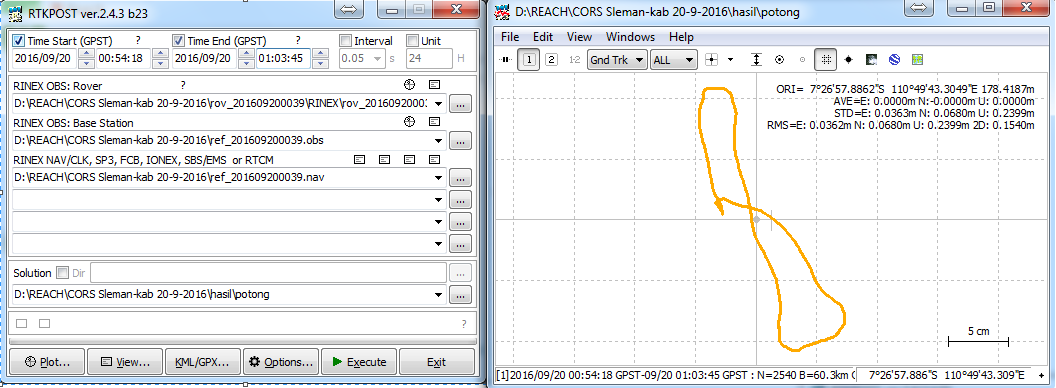
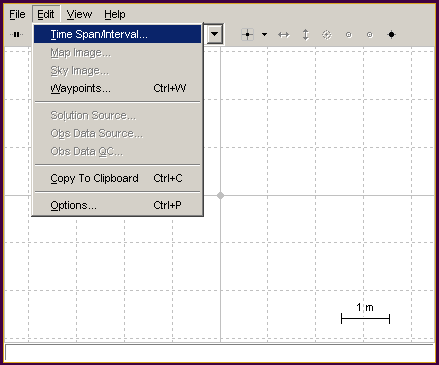
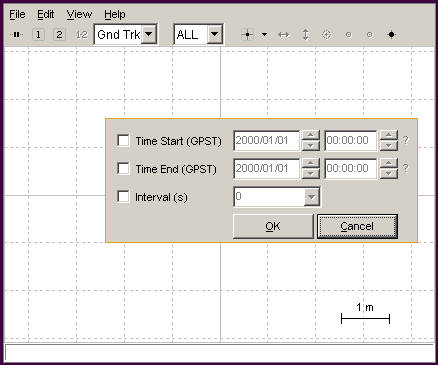
One way is that you can select your fixed points by time. In the menu is an option for start time and end time. Set the start end end time, and then the statistics numbers at the top right of the window will then be calculated only for the time period that you specify.

I have try this, but all result become float. I start in first time fix, and end in last fix.

Hi,

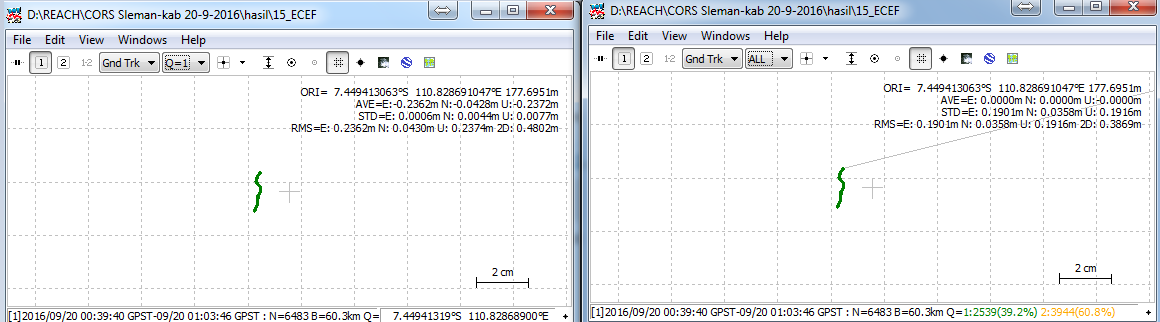
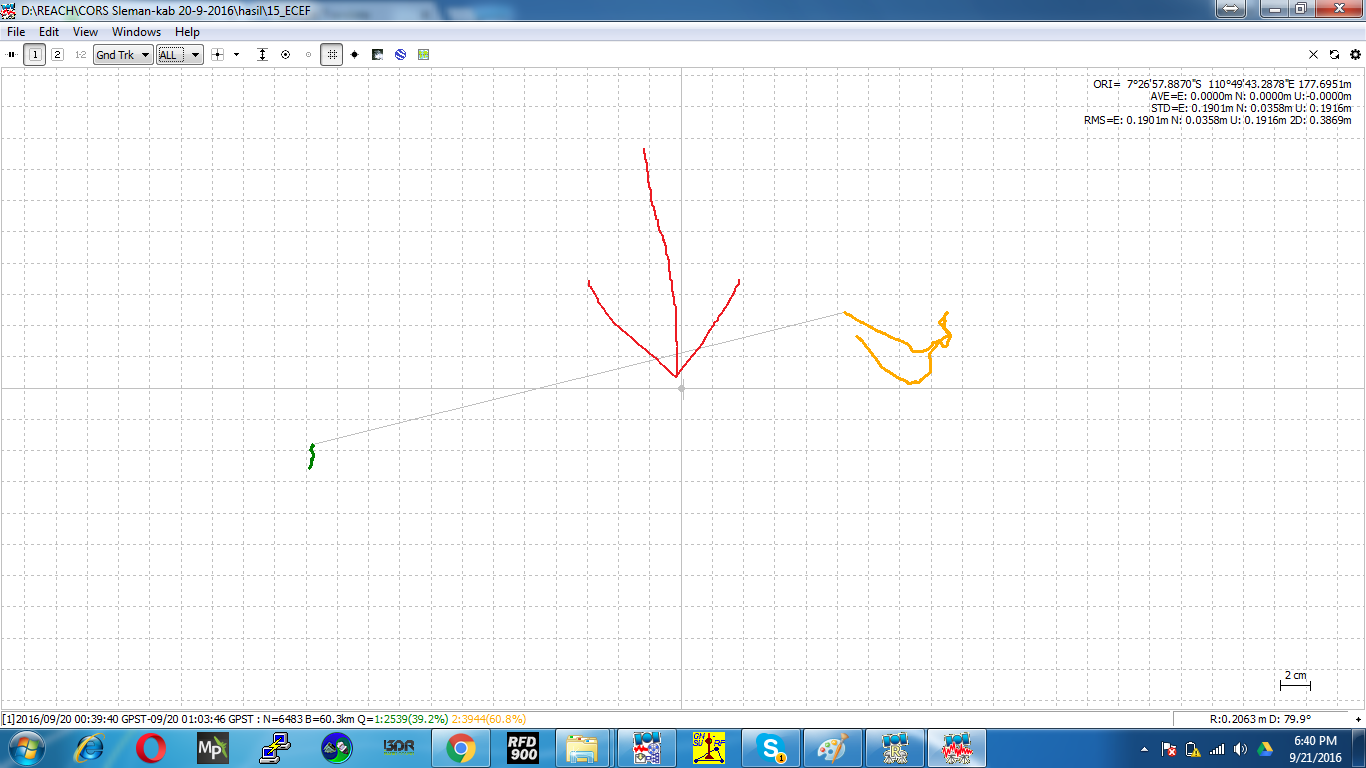
I believe you must set your times to only include the best set of fix points in POSITION mode (next screen under (Gnd Trk). Then switch ALL to “1” for FIX only display. As I recall, this will then only display the FIX points and calculate the average of the “fixed” points only.

RTKLIB is a powerful set of software. Good Luck.

Yes, I meant to set start and end time in RTKPLOT, not RTKPOST. This way you post-process all the data and then analyze only the good portion of the solution.

Sorry, is that like setting Q=1?

pics to show you how:

Thank you @bide, I will try it later. That is valuable. Great.