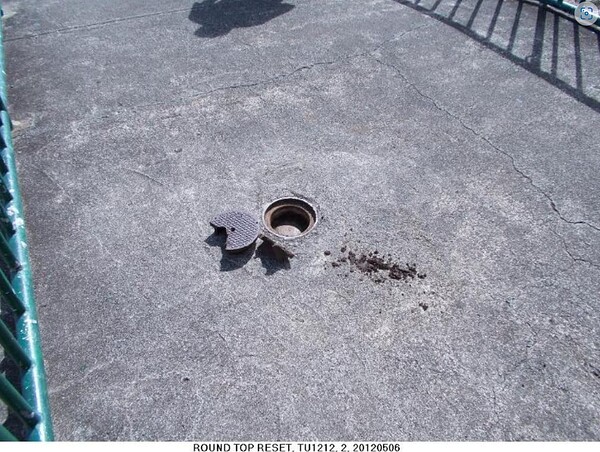
The round icons are predominantly vertical marks with average horizontal accuracy. I just clicked on the first thing that popped up as example and it happened to be a vertical mark.
The ones you want are the horizontal mark triangles. Some are combined in circles because they are both. The most accurate are the first order ones and the best near you would be Tantalus lookout: https://www.ngs.noaa.gov/cgi-bin/ds_mark.prl?PidBox=TU1212
The NAD83 UTM coordinates are in the data sheet, they are permanent and in the case of first order should never change other than possible minor precision refinements over time in the order of mm.
If you don’t have any normal tools to convert to/from NAD83 Lat Lon then use this online tool: NGS Coordinate Conversion and Transformation Tool (NCAT)
In case you miss it your UTM zone is 04 North and you can enjoy the view while you keep an eye out no one steals your gear.
Your correction plots have no meaning without a lot more information on what you did, how you did it, where, how the equipment & software was configured, the environment etc. And this is why you should start checking over known marks as a baseline to help get it figured out and set up right.
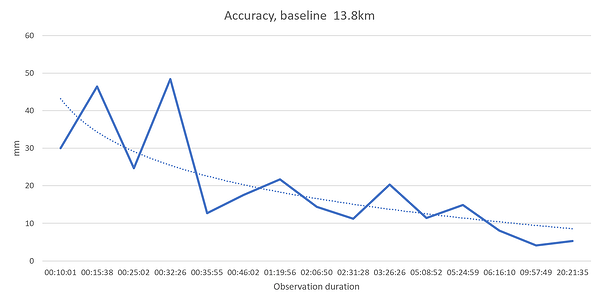
An example only to illustrate, here’s a plot of some testing I did to get a feel for processing Trimble geodetic data over longer baselines through Emlid Studio (without capability of precise orbit & ionosphere/troposphere). The plot is of various length observations over my reference point and shows its taking around an hour to achieve 2cm and become consistent, and longer to converge down to a few mm. Anything less than an hour and the results are erratic. Your case is different, it’s the concept and bigger picture I’m trying get across but also because your earlier mentioned you are only doing 5 and 15 minute observations.
There is one question that does stand out, you state you are using WGS84 yet also state you are post processing against a local CORS base. Most CORS bases provide coordinates in the national fixed plate datum, not WGS84. We do it in Australia and so does the US NGS: FAQs about NCN - National Geodetic Survey Extract: “It is the policy of NGS to overwrite the approximate position in the header with the published NAD83 position, but some older files may not have these corrections”. If that’s the case with your base your resulting differential coordinates would also then be NAD83 - which is the reason it’s done - to avoid all the errors with WGS84.
If your resulting coordinates really are in WGS84, and you are unable to transform in ESRI, the NOAA provides an online tool for time-dependent transformations here: https://geodesy.noaa.gov/cgi-bin/HTDP/htdp.prl?f1=4&f2=1
And if you are maintaining your data in WGS84 to be consistent with ArcGIS Online for government data then you are firstly wrong, because you don’t have to, and secondly you are then actually in an even worse situation.
ArcGIS (and Google et al) default to the Web Mercator projection which is NOT accurately consistent with WGS84. The projection is simplified from an ellipsoid to a sphere to speed up calculations for web serving and user browser performance and so does not match the WGS84 ellipsoid and introduces error and distorts data. And this is on top of all the basic time dependent issues of WGS84 itself.
Think of Web Mercator as the Tik Tok of the mapping world. Many organizations and government departments won’t allow it for formal data purposes. If you want to work in this space then I don’t understand why you are even bothering to try and accurately post-process your data in the first place.
I believe it is possible to tell ArcGIS to transact in the projection you specify, and presumably then access the government data in its robust original projection rather than mincing it through the Web Mercator Tik Tok joke box, but you will have to figure that part out yourself.


