Hi all
We are working on learning how to get the most out of our new Emlid RS2 RTK setup and the EmlidFlow app and have a couple of issues that we have come across so far doing the work we do and I’m hoping someone might have some solutions or advice. I’ll outline the job we are doing currently and the process we are using to get elevation numbers. We are still learning the system and really enjoying that process, so I’m hoping to get some tips on how to better use the app ect.
We are using an IOS device and the latest version of the EmlidFlow app with a survey subscription.
We are surveying, marking out and constructing erosion control banks, water ponding banks (10cm deep) and water diversion banks. The works are to rehydrate and rehabilitate arid landscapes. The banks range in length from 20m or so upto 300m or more.
The rover is mounted on top of a side by side utility vehicle and we drive around a site to do the surveying and marking out of the banks.
When marking out the banks we drive along or around the slope and watch the vertical height while steering left or right to maintain the correct elevation on the slope. We scratch a line in the dirt to visually mark the bank for construction but we also record them as lines in the app to generate maps of the site and to aid laying out the whole project as we go.
The best way I have found so far to see the elevation is to mark a point at the bottom of the site where the water flows off the site. Then stakeout that point and use the “cut/fill” numbers. This makes the numbers larger and easier to see at a glance while driving and looking at landscape features.
Is there a way to make the stakeout numbers larger on the screen? Or can we just display a relative height on screen at all times? It has to be large enough to read at a glance.
The guy that is mentoring and teaching us has a Trimble system and he can set a benchmark height and display that, I haven’t seen this is emlidflow yet. As a side note he really enjoyed playing with the emlid system too.
Every time we mark out a bank we then have to stop staking out the low point to record the line. Then re select the low point again to get the cut fill numbers back to continue with marking the next bank.
Is there a way to mark the line while still staking out the point?
Also is there a way to automatically log points or lines as we drive? Steering and navigating the side by side precisely along a zig zagging contour line and tapping the record point for the line every few meters is a bit cumbersome.
I know you can log the raw data but we need to be able to see the bank locations in the map view as we go.
I hope some more experienced users can give me some advice on how to go about this in the best way possible.
Hi
After I posted my topic I found the one you linked. I read the whole thing and hoped you might respond. We are doing all the earthmoving work on our project as well and I was very interested in how you were using the system on the scraper.
I haven’t used the rover on earthmoving machinery yet but it’s something that I want to experiment with.
Do you think using Field genius instead of EmlidFlow would let me do what I am doing any easier? I haven’t tried field genius yet.
Because no one where I am is doing this stuff we are, we seem to be reinventing the wheel as we go.
@davehofer1993 thanks for the info, I think they do a trial version of field genius so I’ll try it out and see.
I’m hoping the emlid people might chime in as well and let us know if these things are planned for the app and a time frame on them.
So to sum up the things we are requesting, I think they are:
1: Elevation stakeout with the ability to enlarge the Cut/Fill numbers
2: Automatic point and line logging at preset intervals.
3: the ability to record new points and lines while already staking out a point. If this is possible.
If anyone can improve on this request please do… I’m still learning all the correct terminology
For this type of work you should really consider getting a drone and the using your Emlid for GCP’s, checkpoints and documenting hardscape. Once you have your drone map you can easily set points for stakeout in the field. You’ve already got the important gear so get a 107 certification and a DJI Air 2S. The time you are wasting trying to find the contour would probably pay for it in a week.
There’s one idea for your workflow. If you want to see the relative height referring to the pivot point, you can use the Base shift feature. It calculates the offset between known and measured points and applies it to the base coordinates. Let’s take a closer look at how to use it in your case.
You can measure and mark a point at the bottom of the site the same as you’re doing now. Then you need to add the point with the same coordinates but with zero elevation manually in the project. Once you apply the Base shift, you select the measured point for the measured point, and the manually added point as the known point. The app will only calculate the vertical offset, the horizontal offset will equal zero. You can learn how the Base shift works in our guide.
After applying the Base shift, your rover elevation will be calculated regarding the zero, so you’ll see relative heights in the collector. It allows you not to use stakeout and cut/fill values.
You can record the Position log in LLH format. It will contain the geographical coordinates of all rover positions during the observation. You can use the map and collector/stakeout tools no matter if it’s recorded or not, you just need to run it beforehand in the Logging tab.
I’ve noted it and will pass it on to the team for consideration. Thank you!
This feature is already in our roadmap, so stay tuned!
And this can be done as explained in my suggestion. You’ll see relative heights on the screen and will be able to record points and lines. Note that their elevations will be calculated regarding the pivot point which is zero in the described workflow.
Hi thanks for your reply!!
Yes I have thought about this and want to try doing it with the drone and mapping it. I think it would be a better way of doing it. I have a DJI Mavic 2 enterprise drone and have been experimenting with mapping for a while now, but haven’t used ground control points yet.
My main business is earthmoving but I want to bring more technology into what we are doing and do more survey work as well. So any info or thoughts like you have offered is greatly appreciated, thank you!!!
The people doing the survey work on these jobs started with vehicle mounted laser receivers and have now gone to Trimble gps systems. I have them shocked and very excited with the Emlid reach RS2+ setup we have just started with. I think the next step forward will be drone mapping, just have to work out a few issues.
A couple of road blocks I have hit so far are selecting the spill points of the ponds is critical as if they aren’t done correctly they can cause more erosion. I think this would be something that could be a learned ability and overcome, but selection on site is easier then from a map. Although slower like you said.
The second is the area covered by the projects, the section we have just completed covers about 250ha in area and contained 106 banks.
I wanted to map this completed area but haven’t yet due to wind. I need to work out the best trade off altitude for the drone to map it at , so will keep experimenting.
The logistics and acquisition of the drone data is super easy and the M2E is still a great drone to start off with. Where the real work comes in is combining that data with other formats and making it usable to the field. Supplementing aerial data with terrestrial Surveying is paramount in my opinion followed by point cloud editing. Most of use know what we do with points once collected, or at least what we want to happen but imagine how important that effort is when you have 2500x the points.
Hi thanks for your reply @kirill.pavlyuchuk
The idea of using base shift could be very good, it should speed up and simplify my workflow. I will be back on site tomorrow so will be able to try it out and see how it goes. I had wondered about doing something with the base shift but wasn’t sure how to do it. Thanks for the link to the guide on how to use it.
So then all the elevations shown would be relative to the low point, if I have it correct.
Can I then enlarge the elevation numbers on screen to make them easier to read at a glance?
I couldn’t work out how to do this, that was one of the reasons I was using the cut/fill numbers as they are a lot larger.
The logging of the rover positions with LLH data doesn’t really help me if I can’t see that data in the map view while I work. I think this data is only available after it is downloaded at the end of the survey?
I have been thinking about your message and I was wondering if you would mind outlining the workflow you would use to do the job I am doing, if you were using a drone to map it first. You obviously know how to go about it and I am still trying to work it out, so it could save me reinventing another wheel so to speak.
I haven’t done point cloud editing yet so I wondered how much else I am missing in the process.
Would really appreciate the help
Thank you
Just a few thoughts about workflow with a drone here, I hope my bullet points are enough for you to follow.
size of site: We’ve flown about 700 ha in two days with a Matrice 600 with a LiDAR unit. Since the unit is heavy (2.5 kg), flight time per battery is fairly limited. If you fly a small, lightweight drone, flying 260 ha shouldn’t be a problem. When surveying with a drone, the amount of batteries you have (assuming you can charge with a generator while flying) is critical. You want to be continuously flying not waiting for batteries to be charged.
The way I would approach your particular problem:
Pre-plan rough locations for GCPs on Google Maps (or a GIS), place and survey the locations of the GCPs before flight. Fly the site and process data into orthophoto and DTM (using the GCPs to get real-world coordinates) with Structure-from-Motion workflow (e.g. Agisoft Photoscan, Pix4D, etc).
Use the DEM and orthophoto to plan your infrastructure locations in a GIS - you can plot contour lines based on your DEM and use terrain features from the imagery.
When creating the DTM, you need to be careful with your points that they represent actual ground (rather than the top of vegetation).
However, the whole process, while not complicated per se, will have a fairly steep learning curve since it requires a few pieces of specialised software. However, in the longer run, it is a much better approach than following contour lines in the field.
@michaelL I was curious about your number of 2500x the amount of points. It seemed low to me. But if we assume an average pixel size of 2 cm (therefore, a point every two cm), you are right with 2500 points per sqm. And IF you were surveying a point every metre, that would be kinda right, except that with UAV surveys, you are surveying every sqm within the survey area, not just points along a line. For an area of 2.6 ha with 2 cm pixels, you’ll end up with around 65 M points…
Which brings me to another point when going down the UAV route: data management becomes more difficult and important.
Exactly. Otherwise, you can output the receiver’s position via TCP in LLH format to some third-party apps like standard Windows or Linux Terminal. But it hardly helps here because it only shows ellipsoidal heights, while you need to see heights in relation to the specific point.
Hey Jason, my pleasure. Since you already have the gear to set GCP’s and checkpoints you are more than halfway there. What size of sites will you be looking at?
With an Air 2S and the Fly More Kit with 3 batteries you can cover approximately 150-200 acres. In my experience you would need approximately 20 GCP’s and 4-5 checkpoints depending on the shape. The toughest part of flying the drone is simply being able to see it at all times which sometimes causes multiple home locations. I can generally count on a 2000ft radius with a smaller drone like that so if I can get in the right spot I can usually cover that area in one setup.
Locate GCP’s trying to set a perimeter that can be maintained in order to ensure the best relative accuracy in the event that you need to replace interior points. It sounds like your situations may be a one-off so I would set four hard points on the perimeter and simple spray paint X’s inside the area should be fine.
I would also spray down some simple dots or dashes on the tops/toes of any vertical features or steep grade breaks. They don’t need to be shot in but will help make sure the photogrammetry reconstruction can get good hard tie-points in these areas so that you don’t lose too much detail in the DTM’ing process.
Fly the drone. Dronelink is a great flight software. You can get simple mapping missions for a one-time $50 license. It should have everything you need to get started.
WebODM and QGIS are two good tools to start off with for photogrammetry, DTM’ing, contouring and setting the points for stakeout. They are both free so that’s the good part but along with free comes some studying and asking questions of those who have used it.
You’ll need a decent computer with at least a quad-core processor and 16GB of RAM (preferably hexa-core and 32GB) but that will largely depend on the size of those sites. We can get into more detail but that’s the gist.
Thanks heaps for your response!!
I am working it all out as I go so any advice is very welcome.
I have 3 batteries at the moment but need a few more it is definitely a pain not having enough. I have been running the Lite plan of DroneDeploy and so have a limit of 1000 images per upload at the moment and no GPC,s. I have been looking at other options as far as cloud based or offline based, do you have any recommendations on software? The ODM software @michaelL suggested looks very interesting for the price. It is pretty hard to justify the cost of the name brand software when we are just getting this side of the business started.
I have just done the mapping flight over the area we have finished the latest earthworks on and it was about 63Ha/155acres. At 100m altitude with recommended image overlap settings in the app this produced around 930 images if I remember correctly so I may have to do tiles and stitch them together to cover larger areas at this stage. I need to do experimentation on image overlap and altitude as well so I can be as efficient as possible . I have just started playing with QGIS as well so learning how to get what I need out of it is nice challenge.
Thanks again for you thoughts
Hi Michael thanks so much for the run through.
I have 3 batteries for the M2E dual that I have and I need some more for sure. I also have 2 Phantom 4 Pro’s that I got in an auction but they need some repairs before I can use them and put them to work.
The size of the sites vary quite a bit, this first project was split over two sites pretty close together. The first was more spread out and about 250ha I think. I had dramas with weather and software so had to keep moving onto the next one and didn’t get to map it. The last site was covered with a mapping plan of 63Ha/155Ac. I flew it @100M with the standard recommended overlap settings in the DroneDeploy app. It produced around 930 images I am pretty sure and with the Lite plan I have I am limited to 1000. I also can’t use GPC’s. It has let me make orthomosaic’s and measure volume on other jobs which I have been very happy with but moving forward I need to look at other options I think… it is pretty hard to justify the cost of the plan upgrades when we are just getting the mapping side up and running at this stage. Also the fact that I have the Emlid system now opens up huge potential to grow what we can do and the services we can offer! I love a challenge and learning new things is what life is all about so the software options you listed look really interesting and worth trying out… for the cost there is really nothing to loose!! I had just downloaded QGIS before I read you message and started working it out. Steep learning curve but making progress and glad to know I am on the right track there.
On ODM it sounds like I would need a pretty handy computer to run it offline … I may need to update mine but it should be ok to start. How long do you think would it take to process 1000+ images? They say it is on par accuracy wise with stuff from DroneDeploy and Pix4D is this your experience?
It would seem that I could make smaller tiles and stitch them together as an option to get going too?
I need to also play with altitude and image overlap to work out the best compromise and still have enough detail. What would be a good resolution to be aiming for do you think with the follow specs in mind.
The banks are a combination of: on contour, diversion (0.2% slope or fall of 5cm/25m) and the ponds that are horse shoe shaped to hold 10cm of water on the slope.
It was pretty exciting to see that my ground surveyed lines (courtesy of the Emlid RTK gear) matched up with my drone map elevation data too. Shows me the potential of what could be done when I get my head around using the two together. Pretty awesome and exciting stuff.
Hey Jason, good to hear you are getting your head wrapped around it. WebODM can definitely post similar accuracies as Pix4D with terrain but in my experience Metashape is better for terrain than both. WebODM does struggle with vertical (structural) modeling. How long it takes to process greatly depends on the machine you are using and the subject matter but with a standard i5/i7 quad-core, 32gb of RAM and an embedded graphics set I would say 12 hours. If you have a discrete graphics card probably more like 8-10 hours. I have an i9 with 64GB and an Nvidia RTX card and it would be about 6-8 hours. If you have the capabilities and want to give WebODM a true shot do a dual-boot setup on your computer and install the linux version. It is much faster than Windows.
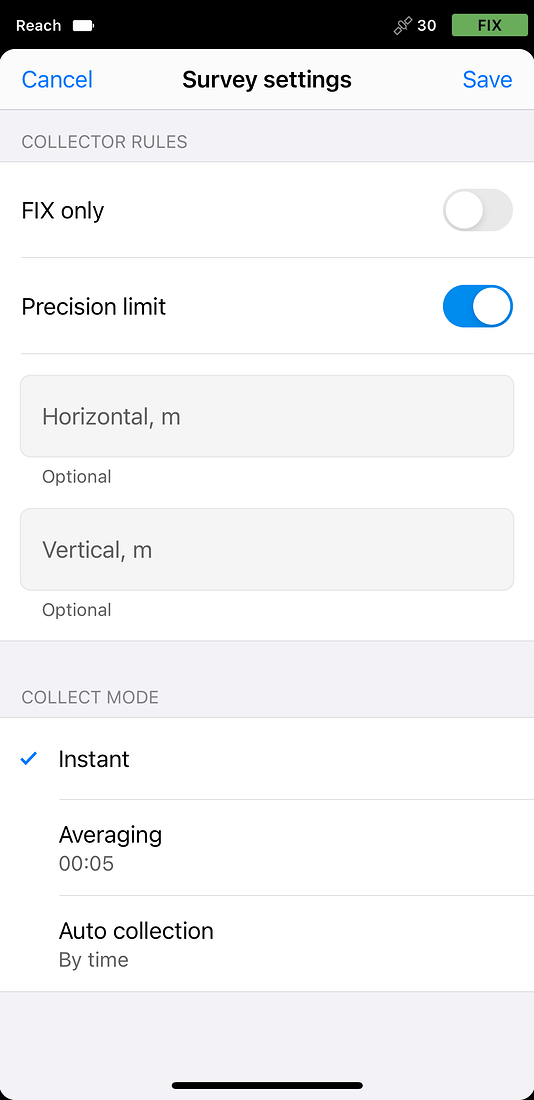
I have an exciting update! Starting from the 10.6 Emlid Flow version, we have an auto-collect feature. This feature is under our Survey plan and allows you to collect points over a specified time or distance automatically.