I am running multiple tests to accurately determine the precision of my RS2 measurements. I measured a set of 4 fixed points (a, b, c, d) while varying the acquisition time of the rover. The acquisition time for each set was as follows: set 1 (10s), set 2 (20s), set 3 (30s), and set 4 (60s). Currently, the only available tool I have is RMS (Root Mean Square) obtained through post-processing the data. While I understand the theoretical meaning of RMS, I would like to compute the estimated error in centimeters (cm) or millimeters (mm) as I vary the measurement time. My goal is to ensure that the coordinates (x, y) have an accuracy of +/- 2 cm (representing the relative position between the base and rover units).
Initially, I assumed that “Easting RMS” (0.004) meant an accuracy of +/- 0.4 cm in the Easting coordinate, and similarly, “Northing RMS” (0.004) meant +/- 0.4 cm in the Northing coordinate, and so on. However, I am now uncertain. I want to confidently inform my clients that the collected coordinates have a horizontal error of +/- 2 cm and a vertical error of +/- 4 cm (as vertical errors are typically larger).
If you have any suggestions or insights on how to better interpret the RMS data to achieve my accuracy goals, I would greatly appreciate your input.
The errormargins you are seeing are basically the precision between your measured points.
As such, they say little about the accuracy obtained.
Here you have rely on statistics and that your correction source is accurate.
With the numbers you are stating, you have to be within 10 km of the correction source, when using RTK, if not, you will likely be outside that error budget.
On of the best ways to ensure you are precise it measure more than once over several hours. Preferably 3-5 times of 10-15 seconds with 1 hour in between. If your stdev’s stay low on each series, you can be pretty confident in your results.
You can also run closed loop calculations, but it is a bit more involving.
Thanks for sharing the link. I would like to do the same kind of test but with the rover respect to the base, I´d like to see errors in terms of “+/-m” instead of RMS only (add an extra column in the post-process archive would be perfect). When you stake out you get the coordinates and RMS as follows;
Example 1 : p1 (10s) - single mode adquisition
914 962.772 m E (sigma_simbol) E 0.170 m (17cm)
6 282 710.036 m N (sigma_simbol) N 0.0131 m (13.1cm)
827.825 m (sigma_simbol)U 0.450m (45cm)
Thanks for your reply. Aside from the RSM , I still I don´t have a method with EMLID to show the error of each point in terms of +/- m of error or a percentage.
This is what I usually do, I´ll give you an example:
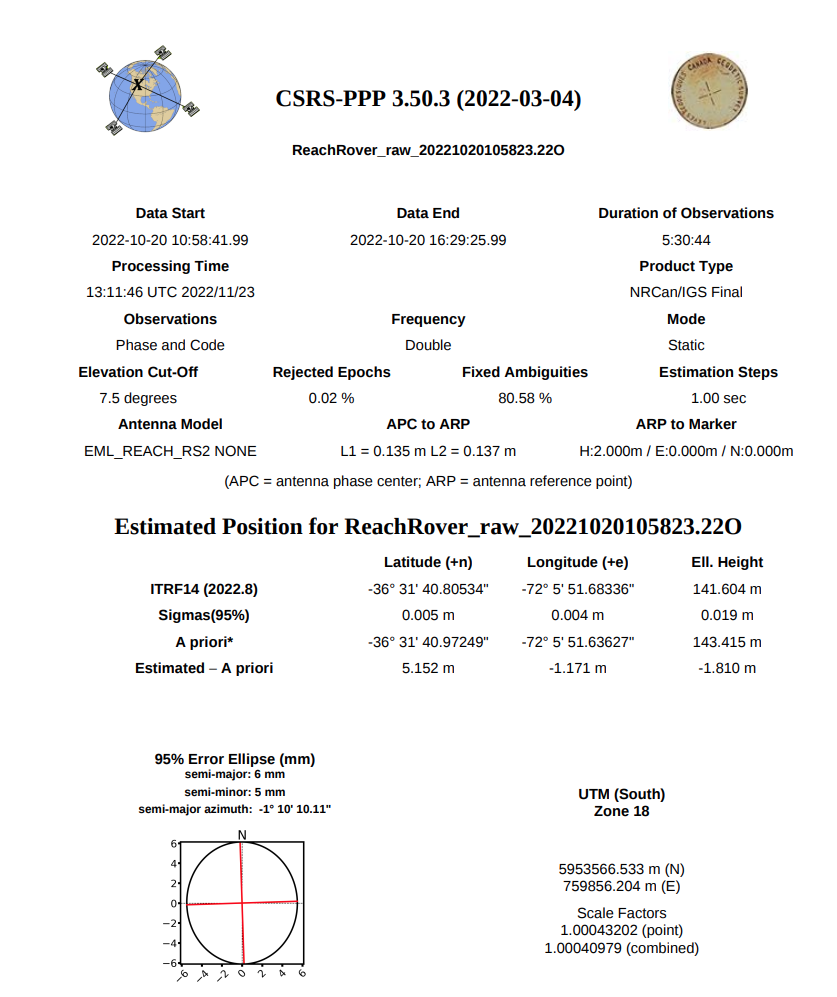
I computed a PPP coordinate with my RS2 after an observation of 05:30:44 hrs. My Error Ellipse (95%) were
-semi-major: 6 mm
-semi-minor: 5 mm
*95% : This is the percentage of the whole GNSS data observed which I can assure that meets the semi-major and semi-minor values shown.
This means that respect to the ITRF14(2022.8) my Latitude and Longitude and ellipsoidal Height at sigmas (95%) are 0.005m and 0.004m and 0.019m respectively. So, I understand that this is how ACCURATE my position is in relation to the ITRF14 coordinate system (please confirm this).
Maybe you can use third party software that is way better than what Emlid can provide to get more details? Lots out there.
I find MicroSurvey FieldGenius the BEST… has a FULLY FUNCTIONAL 30 point limit demo for Windows or Android. May be good enough for testing. LOTS of YouTube videos by Benchmark etc how to use this very powerful surveying software.
The RMS values can be used to evaluate the accuracy of the results. You can find the horizontal or vertical precision value as a horizontal or vertical dilution of precision (DOP) multiplied by three RMS.
A low DOP value indicates good satellite geometry, which leads to higher accuracy. We recommend collecting data with DOP < 2.