I was just wondering if there is an easy way to average the “fix” readings I am getting using ntrip. Or is there a way to select a final coordinate when taking readings.
Many thanks all
I was just wondering if there is an easy way to average the “fix” readings I am getting using ntrip. Or is there a way to select a final coordinate when taking readings.
Many thanks all
Myself, I have been opening the .pos file as a spreadsheet, and sorting by column “Q”. Then I delete everything that is not Q=1. Then I use the average() function to average the latitude and longitude and height columns.
If I save the spreadsheet, then i re-sort by time to keep it in chronological order.
That is a little tedious. I envision a script that would:
I may never get around to it, but maybe someone will write it!
What do you usually get from average to fix furthest away?
My best fixes are usually within a 2cm (maybe 3cm) box, and for that straight averaging would work well.
That doesn’t every time though, so if I get fixes of several centimeters or meters apart, then I will trim the start and end of the position log to keep leave the best group of fixes and then average them, or just make a visual decision on where the center is with rtkplot.exe
Also, I remember reading a forum post recently about convbin.exe flags which could be set to give a measure of accuracy in the RINEX output, but I have not tried that yet.
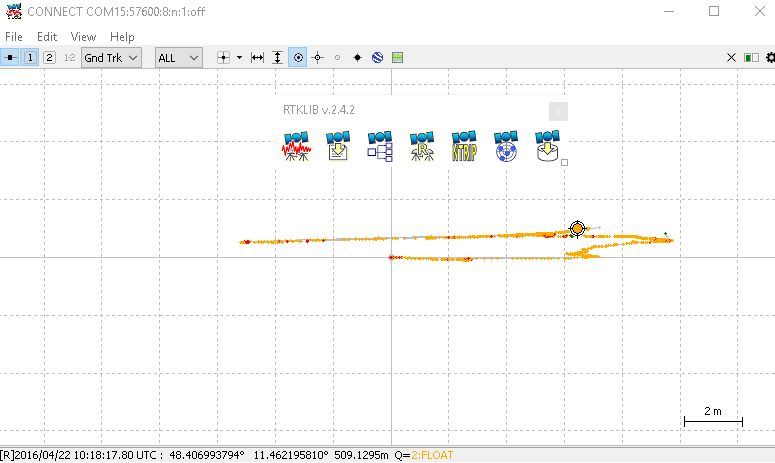
Did you already try RTKLIB? With that you can analyze all the log data and even in-time. It should be possible to find that what you need RTKLAUNCH -> RTLPLOT …serial input of llh, -> GndTrk , you can select fix only(green) or all etc…)
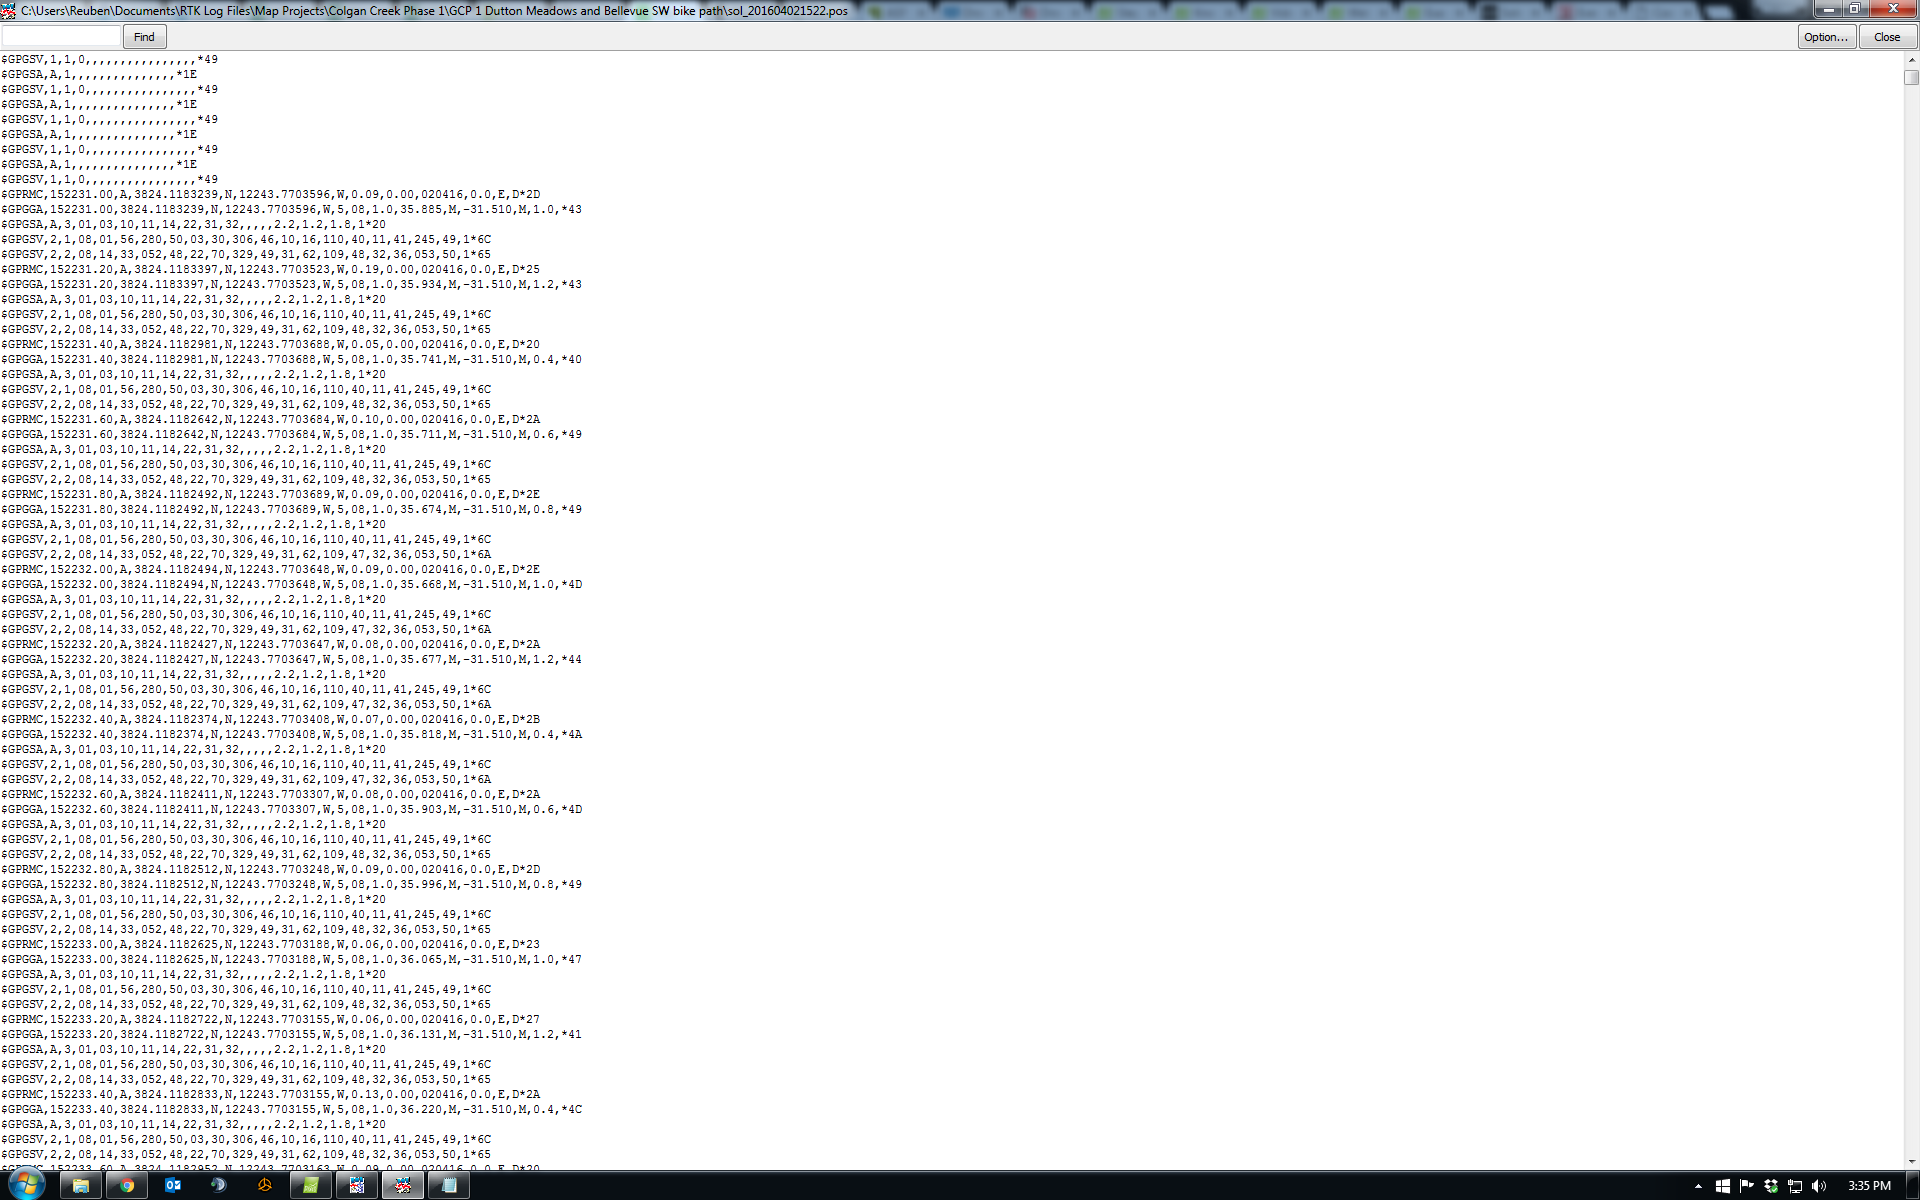
My .pos files don’t appear to be in a format that is easily sorted. I am not seeing a Q anything. I can plot it and make a best guess from the largest “grouped” set, but was hoping to do something a little more methodical.
Thank you guys for your responses.
Just rename the file from .pos to .csv and open up with a spreadsheet progam ( like LibreOffice Calc or Excel )
Thanks for the response. I can open the file in Excel just fine, it just appears that the format is different. I cannot identify which readings are the fixed ones. The .pos files generated seem different than what I have seen from others.
Does anyone know what coordinate system Reach is using for its output?
Ok, so my solution output file was in the NMEA format which is why it looked so odd. Now that I have it in x,y,z, it is much easier to read and organize.
Thanks for the patience all.
I had written a reply to tell you to put in llh format, but you figured it out before I hit the button! I haven’t tried the x,y,z format myself.
I appreciate the help. I am in a bit over my head here.
Just read over this. I’ve attached a quick script that I use to parse the solution log and average the lat, lon, and height. One could easily add a few lines to take care of low AR values. The script finds the current date, selects the data closest to that date, keeps the fixes, calcs decimal date, averages values, and appends those to lists that can be used later (numpy/matplotlib, etc.).
** Note: It would not let me upload a .sh file. So, change the extension from .zip to .sh **
Avg_and_Append.zip (1.6 KB)
 thread from the dead! almost 2 years old!
…still, thanks for the upload!