Hello everyone.
Firstly, I’m new to surveying/GNSS. I bought a couple of RS+ a week ago for various purposes and generally found the learning curve quite enjoyable so far. Also, great products and solution. Well done Emlid 
I’d like to run my thinking by some old hands if possible?
If I want to use a base-rover config, my understanding is that absolute accuracy starts with the base positioning. There are not many free NTRIP base stations in the UK at most places where I’ll be working and it’s not cost effective for me to subscribe to a commercial service at this point in time. So I’m working on the assumption that I can establish my own benchmarks by recording observations over several hours and PP against RINEX from a nearby OS Net station.
I’ve ran some tests over three days last week. I set up a receiver at a location where I was working doing other things. It was probably as bad as it could get for observations, being inbetween 2no. 50m radio masts, a power line and a 15m tree line on three sides. (But is was secure to leave the receiver over night!) The Kp index was also 3-4 and we had quite a bit of cloud cover. I’ll keep collecting observations everywhere I work to get a feel for things that affect SNR etc over time and process form various stations to also get a feel for varying distances too.
With this particular data set I proccessed the Rinex data in Emlid Studio. Really good bit of software. So good, that I didnt read any instructions, but just fiddled about until I got some pretty coloured lines! Considering that until a week ago, I thought Rinex were probably a German rock band, it’s very intuative.
Anyway after using a number of varying sample periods, I came up with the following over a 2 hour period. This was based on GPS only, as the OS Net station only observed GPS and GLO. There weren’t many GLO observations and their location varied quite significantly from GPS.
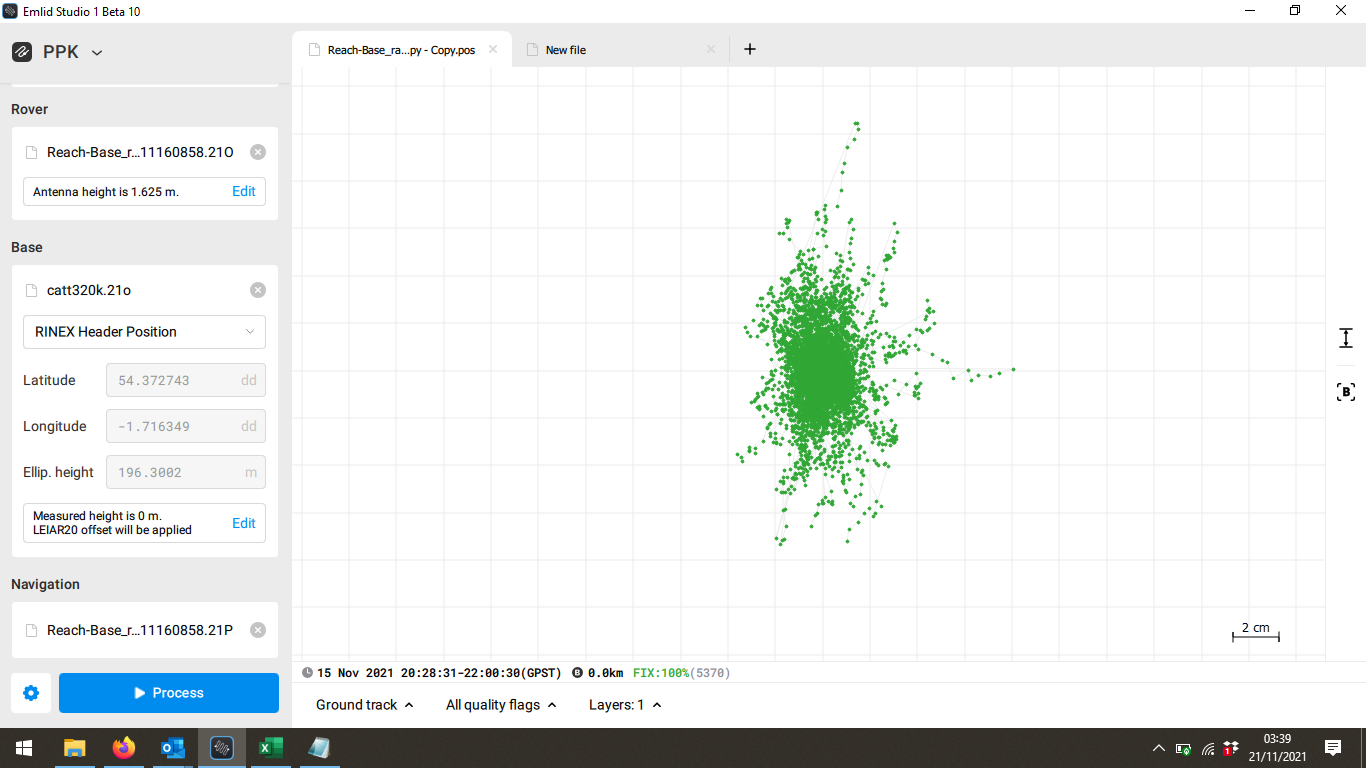
I surmised that if I take the visual cente of the grouping, this would be fairly accurate within a few mm. I took a few shots with the mouse, as did my friend and we copied them down…
54.41745138°N -1.79228324°E 368.5002m
54.41745138°N -1.79228324°E 368.5002m
54.41745138°N -1.79228322°E 368.5016m
54.41745138°N -1.79228322°E 368.5113m
54.41745137°N -1.79228325°E 368.4955m
54.41745138°N -1.79228322°E 368.5005m
54.41745137°N -1.79228323°E 368.5022m
54.41745137°N -1.79228324°E 368.4912m
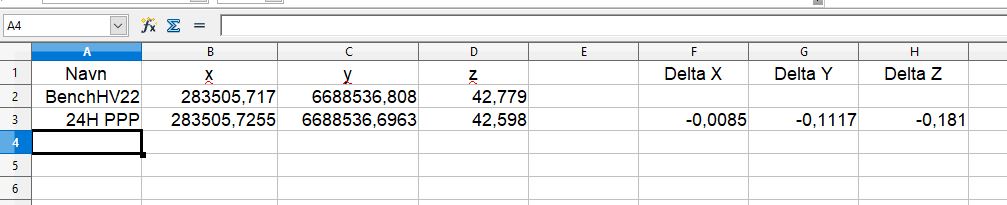
I then thought that I’d check our aim by importing the .pos file into excel and calculating the median. Once in excel I filtered the sample down to roughly a 4x4cm area in the centre of the plot and calculated the Median.
This came out at 54.41745138 -1.79228324 - So our spectacles seem to be OK!
So after all this, I’m still not sure whether this would be the correct method for establishing a known point. Is it accurate? Am I being too pedantic? Is there an easier way, workflow in the absence of an NTRIP stream?
Would love to hear peoples thoughts. Thanks for your time