


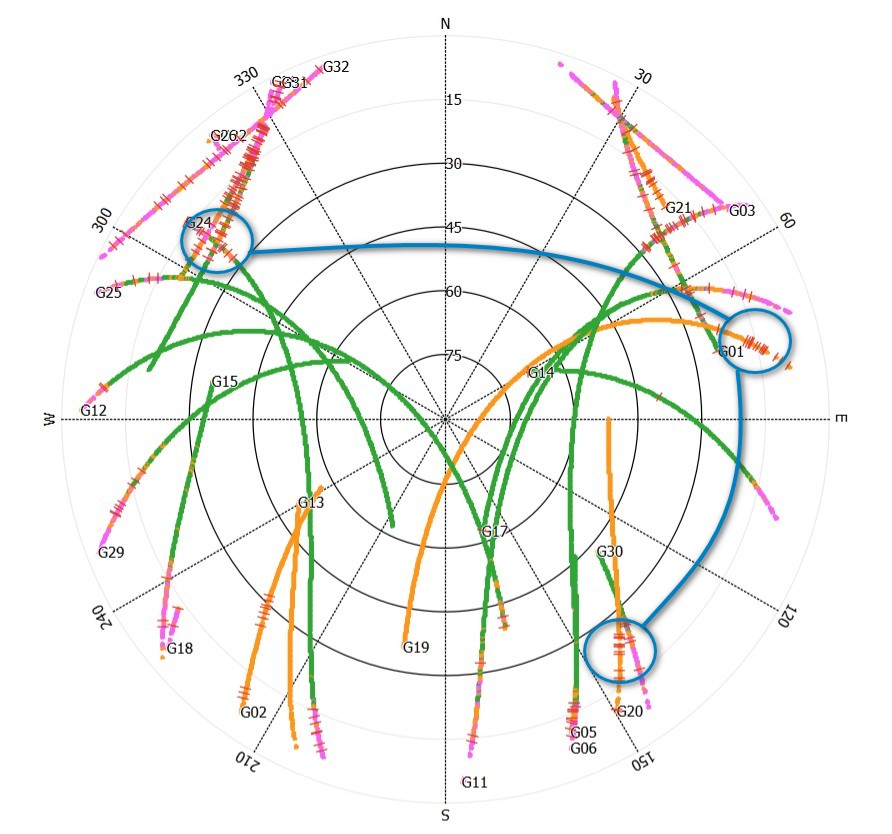
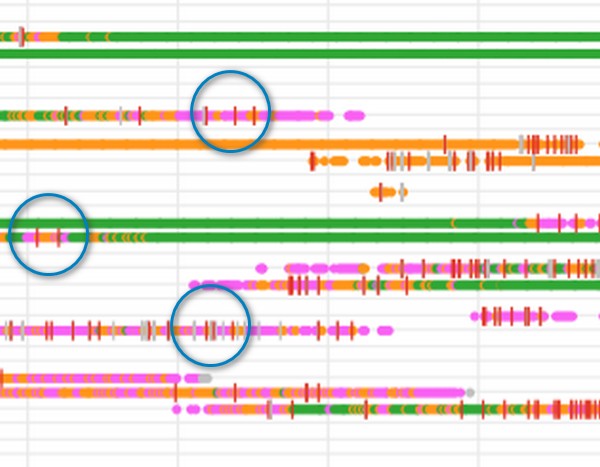
I’m guessing the tick marks on the sky plot below the 30 deg. mark (and on the linear time graph) indicate interruptions (slips) in the signal?
Thanks
I’m guessing the tick marks on the sky plot below the 30 deg. mark (and on the linear time graph) indicate interruptions (slips) in the signal?
Thanks
Yes, that’s correct. It’s a loss of lock on the signal.
Hi Dave,
Yes, that’s true. The closer satellites are to the horizon, the more cycle slips occur.
Thanks for confirming, guys.