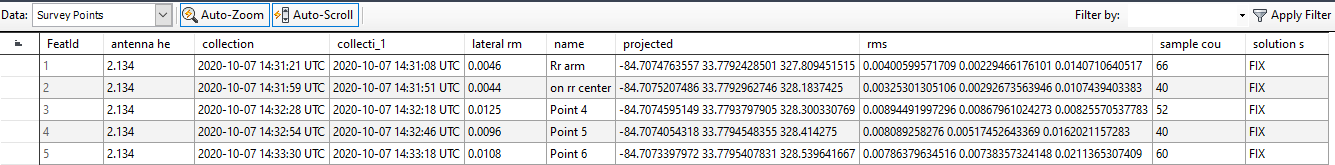
I’m trying to understand the data that is produced from the Survey function. I have not been able to find this in the documentation. In the attached Image I am showing a table of the output data. Can anyone explain or provide link to the various columns? It seems like the two collection columns show the amount of time that elapsed for the collection. lateral rm? rms? sample cou?
Those are survey points which could be formatted to bring into a GIS software, but you would have to change the dropdown on the top left to get the other options.
This is a shapefile that I have already opened in Autocad map3d and Google Earth. I’m just trying to understand what the meaning of the data in the various columns.
Ok, I guess we have a difference in terms. When I think shapefile it is a format that opens natively in GIS software. Civil CAD platforms open GeoTIFFs and ASCII coordinate survey points files.
Pretty much everything on the image you provided are statistics that are seldom if ever used in a CAD platform. You would normally want the Featid (point name/number) and Coordinates. I find it odd that the coordinates are in a single cell instead of separate columns (for comma delimiting), but may that is a difference between what I consider survey points and you consider a shapefile.
Like I said I’m just trying to understand the significance of the data, for example I’m wondering of the sample cou column means how many samples were collected and then averaged. If i understand the data I might be able to identify a problem when one arises. It’s tough not even knowing the right questions to ask when learning new technology by the seat of your pants.
Correct, that would be sample count. Because Reachview does a timed collection it will differ while some other softwares do a specified number of observations so you always get the same, but the collection time may differ depending on your RTK status.
I would be more concerned with the lateral rms column for accuracies. Being in meters anything above 0.04-0.05m would start making me leary for control points where I might reshoot them, but a little higher may be ok for stakeout of some things that aren’t so critical. Keeping in mind that you can export in the field before you leave.
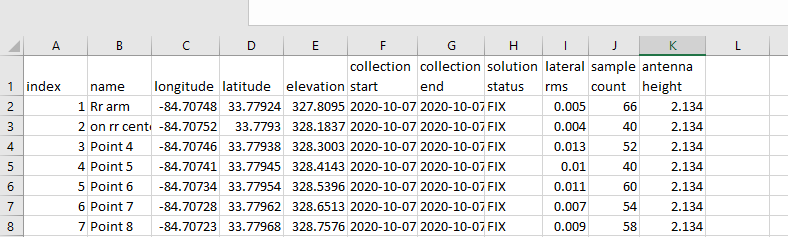
Bear in mind, the reason the field names are truncated is probably, if you indeed added a shapefile, because the format supports field names with a maximum of 10 characters. That’s one of the reasons why there’s a low-key movement to stop using it.
So I guess if I export as CSV ill have the full names. I’ll look at that.
For what I do the data tables that come along with shapefiles are a really nice feature, so for me they are good.
False fixes are the devil. There are times that a float with PPK can work, but you should be able to watch the PDOP and AR Ratio on the survey interface for comfort. PDOP no higher than 4.0 and AR Ratio I am not really sure, but I bet someone here knows. My thought is 750, but it bounces around so much it’s hard to tell sometimes.
That’s an interesting finding. There’s no reason not to export these fields and it could be a suggestion for Emlid to add them to CSV export.
In any case, I don’t know if you use GIS software, but in QGIS, there is a very useful tool called Refactor fields that enables you to fix these problems. Just export the resulting layer with fixed attribute names to a format that supports more characters, like GeoPackage, and you’ve got something less cryptic to work with.
I do use QGIS mostly for its great ability to handle any file type coming in and then being abe to export to alost any platform as well. Beyond that I don’t do much with it. It a tremendously robust yet challenging piece of software.
The fields in the table include the following information:
Antenna he - The distance from the bottom of the receiver to the antenna + pole’s height
Collection - Collection end time
Collecti_1 - Collection start time
Lateral rm - The root mean square of RMSE values of the north and east axis
Name - Points’ names
Projected - Points’ coordinates
RMS - the RMSE of the coordinates. The three numbers are RMSE per axis (north, east, up)
Sample cou - The number of measurements that were used in the calculations
Solution s - The solution status (Single, Float, or Fix)
PDOP is a position dilution of precision. The more satellites are directly above you, and the less near the horizon, the lower the PDOP value is. We don’t recommend collecting points with PDOP higher than 2, as bad satellite geometry might affect accuracy.
AR Ratio shows how many times is the best solution better than the next one. When it’s higher than 3, Reach states a Fix.
Had myself a false fix yesterday. I was 0.5’ high and 0.9’ E. For the new guys out there, if you want to avoid false fixes make sure to check yourself before you start shooting, and after you stop shooting. Sometimes it can help to do it during also just so you don’t waste a day.
There are various ways to do it. If you are not localizing it can be more difficult.
Way #1 (Localizied) - Once you have your base and rover set up and have a good fix, go to a known point such as site control setup by a surveyor and take a shot. If you used that control in your localization you should hit it dead nuts. +/- .02-.03. You can also check elevations if they are written on the back of stakes and make sure you are coming up with the same readings.
Way #2 (Non-Localized) - The preface of this is that you have already set up the site and have set your base on a known point and entered the coordinates correctly with the correct antenna height. Same steps, once your base is set up, go take a shot on a known point that you had previously set out. If you don’t have the same reading as when you set it you messed up somewhere.
Depending on the conditions, GNSS receivers can get difficulties with obtaining fix. For example, when they are too close to objects that reflect radio-signals or have a significantly reduced sky view like under dense tree crown cover.
Multi-band receivers like Reach RS2 can work with a partially blocked sky view like under light foliage or with some trees or buildings nearby. However, we still recommend providing the unit with a clear sky view 30 degrees above the horizon for the best result.
To prevent difficulties with calculating the solution, you can also check the following parameters:
DOP - We don’t recommend collecting points with DOP higher than 2, as bad satellite geometry might affect accuracy.
SNR - Reach should see at least 4 satellites with 35 or higher SNR.
Age of differential - Under normal circumstances, it’s near 1 second. If it’s much higher, the connection to the base is likely lost.