Good morning,
is it possible to read nmea output files with rtkplot or some other free software?
Thank you
Good morning,
is it possible to read nmea output files with rtkplot or some other free software?
Thank you
Thanks for the reply.
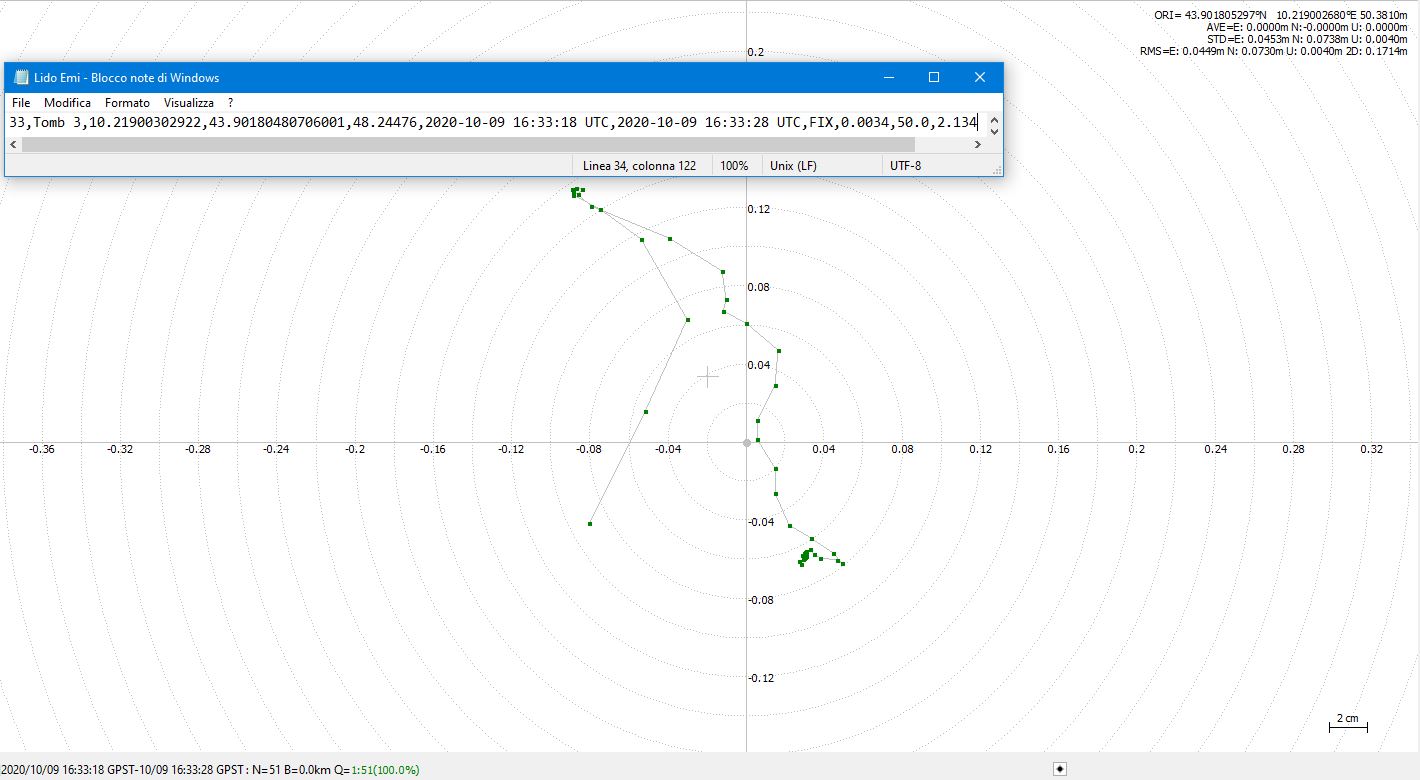
I tried to compare the solutions provided by the Reach Rs 2 CSV with the solutions present in the NMEA file. Accuracies are not always consistent. Do I have to take into account the CSV file or NMEA solutions on RTKPLOT?
Thank you very much
Hi @francescox,
These values are just calculated differently.
In the ReachView, we use RMS for accuracy estimation. The RMS is calculated from the error computed relative to a continuously updated average position at the Survey point.
The Lateral RMS value you see in the CSV file is the root mean square of RMSE values of the north and east axis.
In the RTKLib, there are both RMS and STD. The difference from the ReachView is that we don’t have a continuously updated average position. We have a ready set. The average for this set is the coordinates of center origin. The difference between RMS and STD is in the center origin calculation method.
Basically, RMS = STD. However, if we have the set with Single, Float, and Fix solutions and want to calculate RMS and STD for Fix solutions only:
For RMS, the coordinates of center origin will be calculated from all solution statuses, but RMS will be calculated for Fix solutions only.
For STD, the coordinates of center origin will be recalculated from Fix solutions only, and STD will be calculated for Fix solutions only as well.
This topic was automatically closed 100 days after the last reply. New replies are no longer allowed.