Feature request: logic on time mark pin

but you could switch to a fixed picture intervall which does not stop at the turns. This would make error detection far more easy. If you know that a timemark should occur every 1500 ms ±10ms it is very easy to see that something is wrong with the log file. Or you export the data of the planning tool and then you can check the planned picture coordinates against the existing timemark coordinates.

And in Photoscan it is very easy to delete the pictures which where made during the turns (I’m not shure whether you need to do that anyhow if you have a gimbal…).

map pilot and GSpro seem to both stop the photos on the transition legs making timing less consistent

yes, gimbals cure a lot of UAV movement sins! but gimbals can’t fix blur caused by photos taken during turns. some of these need to be deleted.

when i’m looking to compensate for missing photos I just compare timestamps between emlid event times, and a list of photo timestamps output using exiftool. I find the photo(s) corresponding to the missing event and either exclude it/them from my spreadsheet position extraction, or interpolate my own event time and down-weight the position accuracy estimate.

I also have a script sorting out blurry pictures, but that is astonishingly complicated and does only work if all the pictures show a very similar object (green lawn = perfect, green lawn with a pool = bad results). I also think that the image quality tool of Photoscan sucks with different objects in the pictures.

Next thing to include is: if len(timemarks) != len(images): read exif data from images, compare datatime objects, find median image interval and interpolate missing positions.

nice.

are you researcher, or private enterprise? (or both)

I’m still figuring out whether I can realize both or at least one of the two :wink: Unfortunately the marked situation in north-east Germany is very challenging. I also realize that the aeras of application are limited in Germany, especially for me since I’m an utilitarian and I’m not ready to contribute to a lot of activities such as building of animal farms and climate change driving things… .

I would love to rescue fawns from being killed during grass mowing, but the farmers are not ready to pay even 5€ per ha, even though they get 350€ per ha subsidies from the European Union… . I think I would need 10-15€ per ha to make a profitable business.

tangent question for fellow photoscan user: have you tried rolling shutter compensation option?

I ask because when I used it, it seemed to give answers that were too good. Which made me suspect over-parameterisation of the problem, if that’s possible with so much data. It seemed to me that reconsidering each photo as an independent row of pixels was overdoing it. and if you didn’t place constraints in the solution on rates of yaw/roll/pitch and demand uniform rates of change, then you could end up overdoing the solution.

I’m not claiming any knowledge that they’ve got any of this wrong; I have no knowledge of their modelling of the problem, but I just think when things seem too good to be true than they often are.

My camera has a mechanical shutter, my smaller raspberry pi based drone is still in development. I also realize that a mechanical shutter may have a rolling shutter effect, but I wonder (as above) whether that is relevant if the drone moves with 8 m/s @1/1000 = 0.8 cm on the ground?

What is your profession? Why don’t you considering an Arducopter mapping drone with a Sony A6xxx or the budget solution RX100 MK2? I think that would save you a lot of problems.

I am a surveyor. I would have to find the time to learn about and build an arducopter which could be too much, considering what I do out-of-hours already.

I tried using the rolling shutter compensation when we used the original P4 without mechanical shutter. I don’t use it anymore with P4P, but even with mechanical shutter, exposure time is still non-zero, and I wouldn’t get near 1/1000 exposures. I tried to determine actual exposure by photographing another drone on the ground and calculating exposure time from movement blur and assumed idle RPM. It seemed like, roughly, exposure time took about 1/2 claimed shutter time. e.g. 1/240 appeared to take .002 sec. So reported blur in map pilot app could be 2 x pessimistic with a P4P mechanical shutter. Take this with a huge grain of salt though; I could have totally and utterly made a steaming pile out of this ‘experiment’.

We have mechanical shutter P4P and my bespoke GPS carrier and spreadsheet are now at the point where my workflow is pretty smooth. I would say I’m expressing wishes regarding the time marks, rather than serious needs. My backwards time offsetting spreadsheet works pretty well and grid coordinates calculated using my spreadsheet compare at the few mm level with directly calculated emlid positions (except in turns) I’d hate to start again unless the benefit to me and the company were clear.

For example, a DJI Phantom 2 Vision + with the readout time of 74 milliseconds, flying at a speed of 8 m/s (18 mph) and at 70 meters above ground will have a vertical displacement of 10 pixels due to the rolling shutter effect. The drone has moved almost 60 cm during the image readout. from pix4d

If I apply that on my szenario I don’t see a major source of error even if the real exposure would be 2 instead of 1 ms (whichI don’t expect to happen with a “real” camera).

If I come up with a idea how to do the test you described I will test it, its a good idea. A simple test would probably be to compare the difference between different camera models using the same manual exposure (shutter, aperture and iso). But since the aperture is depending on the image plane size it might be not precise enough.

What’s the speed you are flying your missions with?
What kind of surveys do you do and whats the typical area (ha) of these surveys?

What is the accurac of your maps/models compared to a L1&L2 RTK measurement you can achieve with your setup?

i try not to fly above 6m/s when my reach m+ is strapped to the UAV. If i’m flying a decent sized site then I wouldn’t want to go much slower either.
If i am doing a smaller site then i’d fly more like 3m/s.
There is no typical area. We fly 1000sqm up to 50ha. Flights are sometimes just to produce a nice orthophoto, sometimes excavation or stockpile volumes, and sometimes to produce levels/contours.

accuracy on identifiable painted control marks is a few cm at worst once you provide the model with a reliable scale. vertical accuracy on identifiable marks also seems like a few cm. Accuracy on the surface generated by depth maps seems to be under 5cm when compared to ground truth.

from memory, when i was controlling elevation of the camera stations by tracking with a total station, instead of reach m+, the vertical accuracy wasn’t really worse than 2cm when flown at around 60m altitude and the reconstructed surface was from good texture.

1 Like

Thank you for your answer!

hi Tobias,

Program starts up in a window too small to see selection buttons on the right hand side. This could be my windows 10 scaling. i don’t know if you can overcome this and make it suitable for all screen scales.

if you are writing this for wider consumption i would add the options of listing images by .JPG and .DNG at least.

you are outputting tab delimited files. i would make it extension .TXT and call them tab delimited text instead of .CSV. i didn’t see any commas.

i used your program and told it to calculate a time offset of 0ms to make sure it gave me the same values back. it did not. it seemed to calculate random offsets that would correspond to random values between 5ms and 300ms. floating point precision problem? i tried 10000ms offset and am getting 400 metres position offsets. and they are off track. i should only be seeing 50m. and they should appear somewhere on the original track.

td

i think i was using it properly…

1 Like

Ok, that is bad, its the time where everyone distributes banana products… . I did run out of time for a proper testing, please excuse this “Rohrkrepierer”. Thank you for your help and I hope you are ready to try again!

Program starts up in a window too small to see selection buttons on the right hand side. This could be my windows 10 scaling. i don’t know if you can overcome this and make it suitable for all screen scales.

I have to figure out how to solve that in an elegant way. I start with a far to large window for now. I hope that helps.

if you are writing this for wider consumption i would add the options of listing images by .JPG and .DNG at least.

ok, I added some file formats

you are outputting tab delimited files. i would make it extension .TXT and call them tab delimited text instead of .CSV. i didn’t see any commas.

you are right, that is because Photoscan does not import *.tab files and one could read csv as character separated values. I have changed the output file format to *.txt.

i used your program and told it to calculate a time offset of 0ms to make sure it gave me the same values back. it did not. it seemed to calculate random offsets that would correspond to random values between 5ms and 300ms. floating point precision problem? i tried 10000ms offset and am getting 400 metres position offsets. and they are off track. i should only be seeing 50m. and they should appear somewhere on the original track.

I think I found part of the error which I introduced by adapting my correction of the antenna offset to calculate the time offset. I think I have now boiled it down to a floating point precision problem (some mm difference).

Comment/edit: I have realized that it is not a floating point precision error but it is an error which is caused by the fact that the time mark time information is rounded in the pos file. While it is 2018 11 10 11 32 37.5185379 in the observation file, its 2018 11 10 11 32 37.519 in the pos file. That is where the error comes from. @wsurvey can you replicate that error in your spread sheet?

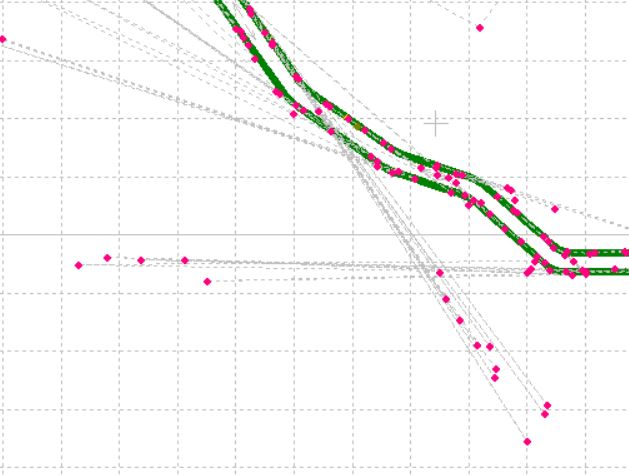
When using the dd.dddddd WGS84 coordinate system the problem results in an error of about 3 mm when entering 0 ms as time offset:

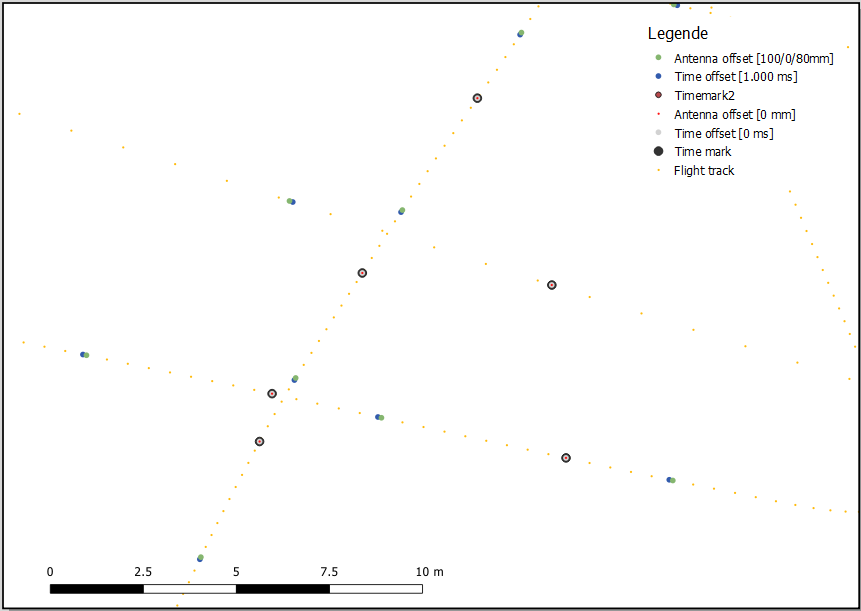
You might have notice a different distance for the 1.000ms time offset. This is due to different flight speeds (~6 m/s and ~2 m/s). Flight direction can be seen looking at the antenna offset, this green point is always in fight direction after the blue time offset point. The image interval was about 2.800 to 3.000ms. The logging frequency was 5 Hz, so the distance between each yellow point represents 200 ms (-> flight speed).

For XYZ ECEF coordinates the error is about 12 mm due to the larger numbers we are dealing with.

If you or someone is ready to make another test eventhough the floating point precision problem still exists you can download the updatet version here: downlink.

I’m still confused. I have the following data:

							x-ecef(m);y-ecef(m);z-ecef(m)

Time mark: 2018 11 10 11 32 37.5185379;3660914.3358;897146.0474;5128138.172
Previous trackpoint 2018 11 10 11 32 37.3900000;3660914.2055;897146.0238;5128137.9952
Consecutive trackpoint 2018 11 10 11 32 37.5900000;3660914.4038;897146.0675;5128138.2898

Even of I interpolate that by hand I cannot get the exact time mark position (but of course, I get closer than before).

you may not get it exact; emlid’s calculation can be faulty. that’s because some time marks are being recorded the epoch after they should in the RINEX file. meaning the interpolation is happening between the following time epoch and the one after that. use the following time mark, and the one after that, and do a linear interpolation backwards. see how close that gets you…

use RTKPLOT to overlay an events file over it’s track and look at the curves. you’ll see it there.

my spreadsheet doesn’t deviate from the processed track as i made sure my first order of business was to calculate the offset event times first, then look for the adjacent epochs to the corrected time.

Thanks for your answer!

Do you mean that the track points chosen for interpolation are not based on the time but on the position of the timemark within the Rinex/observation file (which would correspond to the fact that you cannot enter the timemarks at the beginning of the observation file)? Is that true @emlid?

I fixed the deviation from the track, there was a calculation error. I think I do the thing you describe (based on the pos file): add the offset to the time mark, find the tracks point which where recorded before and after the offsetted event time. Do you use the time recorded in the observation file or the rounded values inside the pos file?

yes. track points adjacent in position to the event marker seem to be used, not adjacent in time. RTKPOST seems not to handle out of position event markers well. Topcon Tools can, so you can stack all your event markers at the top of the RINEX file.

i use the times in the events pos file. At the speeds i fly 4 or 5 decimals is enough and i don’t think the duty cycle that drives the LED allows for a granularity of LED events better than 1/25 s.

output more decimals then?

I can understand that you stick to your workflow. It is very nice that you contribute all the information anyhow, thank you very much!

I would like to implement your error estimation. I think you described it before, so I will try to implement that.

I know that the deviation is small compared to the total measurement error. But since all errors add up and multiply during the calculations I think it is a good idea to start with the most precise time information. With the right time information my interpolation factor changed from 1.687 to 1.559.

I think I will now change the code so that it reads all time information from the observation file and later on also rising and falling edge times from the rinex file.

Anyhow, I would really like to know how @emlid exactly calculates the time mark position and where are the sources of error in that calculation. Please help @egor.fedorov, @tatiana.andreeva, @dmitriy.ershov, @rtklibexplorer, @TB_RTK