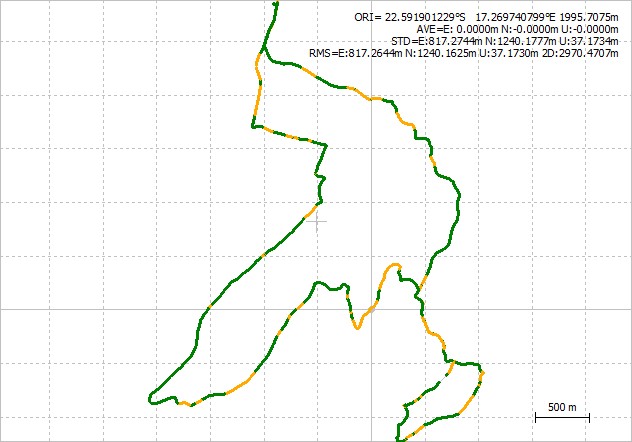
I have a difference between my tracks when I do the post-processing with the base data and with the nearby NTRIP data. The base was set with connected to the same NTRIP stream and an average fix.
How can be the differences so “huge” > 2 m east/west and > 2 m south/north. I assumed when I have a fixed on the base, that difference should be much smaller…
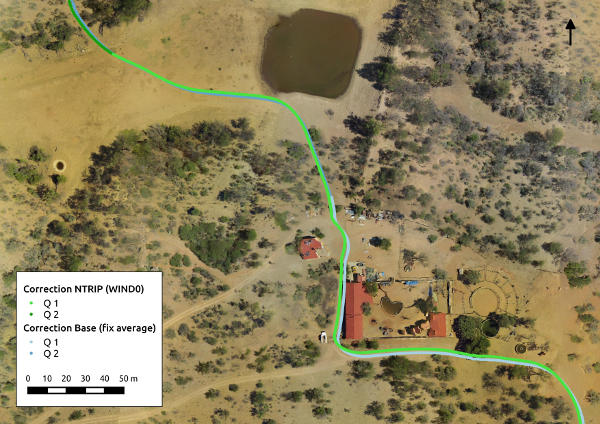
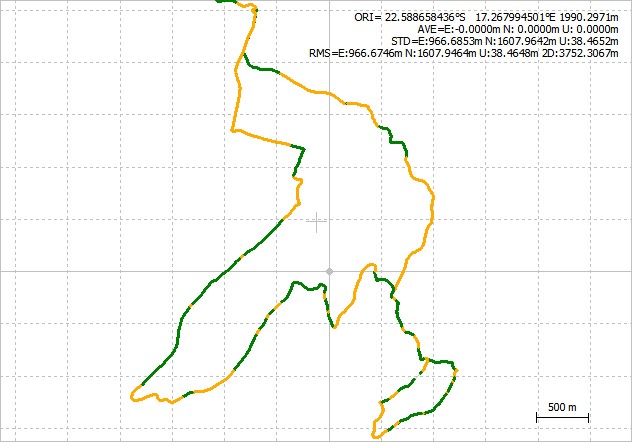
The other part I don’t fully understand yet is, why I have differences in which parts of my track have fixes depending on the base/NTRIP source.
Well the most important question for me at this point is how do fix this difference?
You can see in the fig. that there are different parts of the track in float/fix
Some base stations provide their coordinates in a different format or datum. As the FIXed solution is relative to the base position, there must be something different about the base position in the caster and in your Reach. Please share the info on your caster.
2.   Site Location Information
 City or Town             : Windhoek
 State or Province        : Khomas Region
 Country                  : Namibia
 Tectonic Plate           : AFRICAN
 Approximate Position (ITRF)
   X coordinate (m)       : 5633708.7802
   Y coordinate (m)       : 1732017.6960
   Z coordinate (m)       : -2433985.8026
   Latitude (N is +)      : -223429.71
   Longitude (E is +)     : +0170521.95
   Elevation (m,ellips.)  : 1734.7
PS: @egor.fedorov are you sure that it is an transformation issue?
From what i could see, i would think long baseline with IGS is the cause of mismatch. BS ranges from 16-20km in PPK mode, that is 6-8km more then the recommende value. When compared to Reach base, BS is 0-4km and far better data to work with.
I would rather do static process with Reachbase and IGS, and then PPK Reach with rover,that would give you the most accurate measure i think.
Other then that you could maybe process the result a bit better from IGS and tweek it to line up more, but dont think it will line up perfectly.
Other then that, VRS is an option maybe ?
You could do a test. If you drove the same route, but stoped and did static measure for few minutes and repeated this few places around the track, and then processed those static points with Reach base vs IGS base, i am pretty sure the resulte would suprise you. Static handles long baseline better then kinematic.
That’s what I thought I have to do, though I still don’t know exactly the processes… Let’s see if I can figure it out by my self.
But that only makes sense, if I can improve and verify the Reachbase position, right?
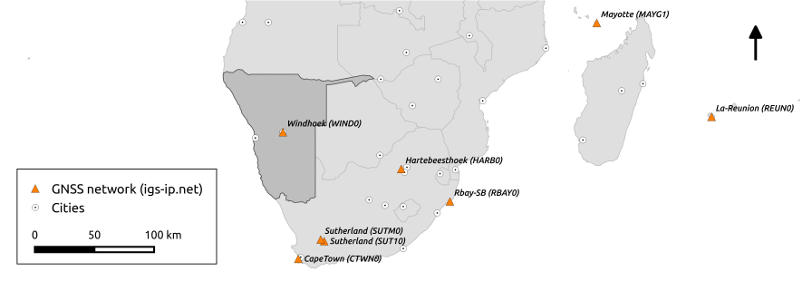
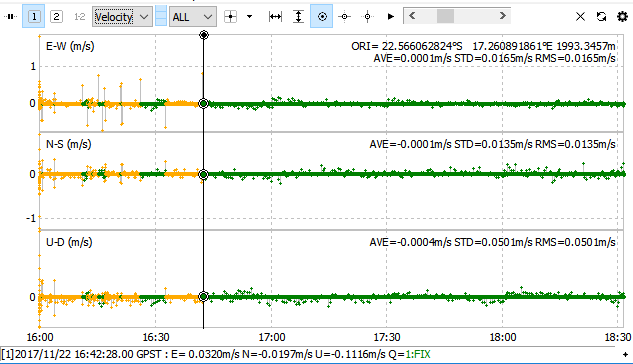
I have to admit that I hat firs to read about it (by the way thx for the hints), before I know what you mean. For now it’s only about PPK as I’m back in Europe, also the there is not something like a good GNSS network there (s. fig).
I have a track from another day where I measure some GCP that should work for a test. Can you give me some more hints about the procedure? I’ve never got that munch into the detail of PPK…
Be aware of the baseline and use static measure. Postprocess it in static mode and log few minutes at each point. This measure should be done two or three times with minimum 15min if three measures or 30min if two measures. If all two/three points line up, your are golden (most likely )
Edit: If you already made a run, from the processing point, do control measures between each GCP and use it as base-rover setup. I assume you have the .ubx file.
But i hear its challenging to do survey in Lukeland
.
In your first post at the top, how did you establish a base coordinate for post-processing? Was it by RTK from the same NTRIP source? or some other way?
Yes, well I did it with RTK in the field from the same NTRIP stream. I had a 3g connection for the time until I got the average FIX.
With the PPK I just used the data output from Reachbase. Actually I still didn’t fully understand how to recalculate the base coordinates in the PPK step and how to use that output for the correction of the Reachrover.
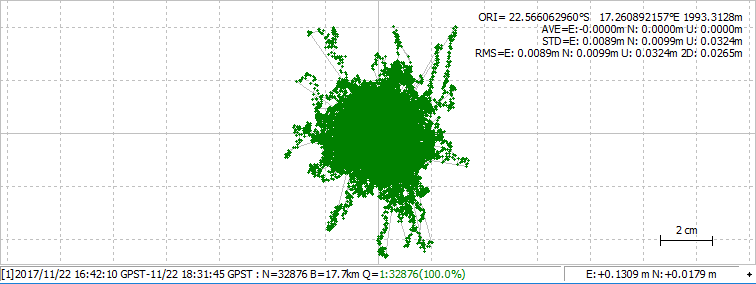
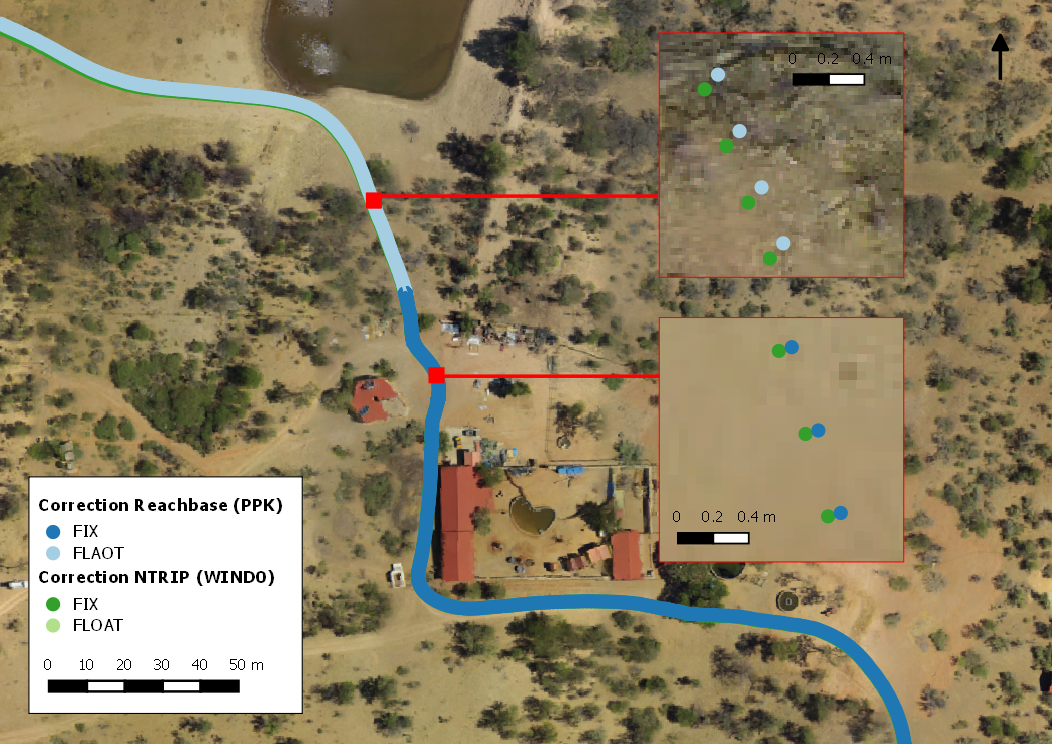
From what I can measure by hand the difference is much better:
FIX < 10 cm
min. 1 FLOAT ~ 30 cm
Will just running some statistics to see what are the “real” difference in numbers, but from what I can see like this its totally in an acceptable range.
So basically the problem was that I got the Reachbase coordinate in first place from the RINEX header position (which is the one from the field, right?). Locking into the Reachbase signal, I saw that it took over 40 minutes to get a steady FIX. And now I remember that I might have just FLOAT the average in the field 'cuz it took forever…